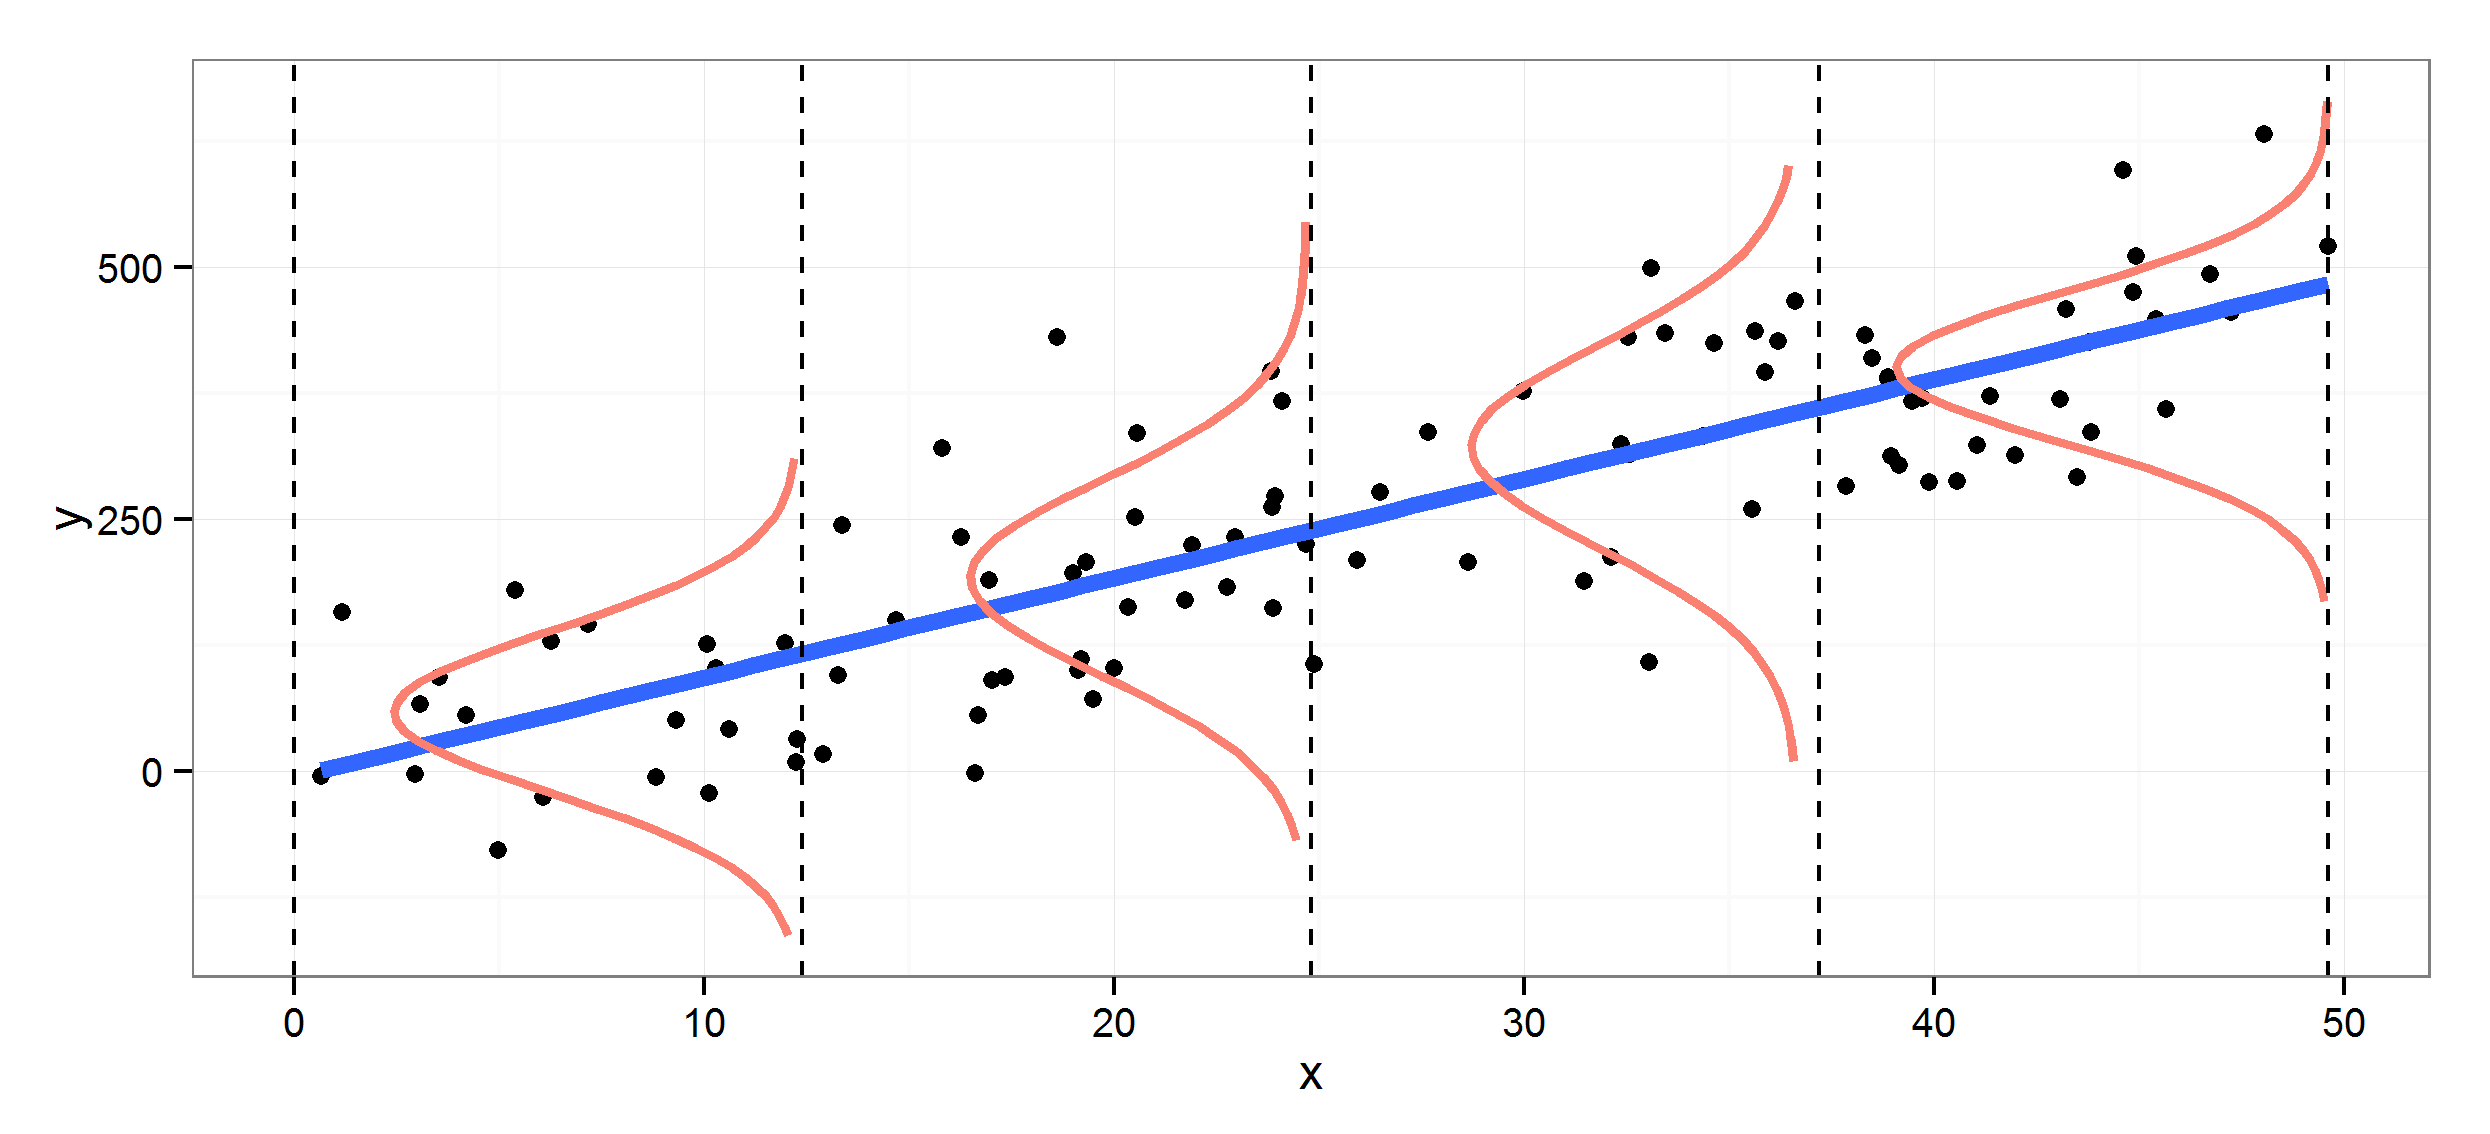
Something of this style, although not exactly in the context of regression.

I have 3 variables, y1, y2 and y3, and for each variable I intend to plot its density (with kdensity) vertically, versus a counter (x=1,2,3) on the horizontal axis.
Do you know how I can do this in stata? I am a bit lost. I hope you can help me.
Greetings!
0 Response to How to plot vertical densities for each variable?
Post a Comment