I have 1300 variables, and all the variables contain capital letters in their names. I want all of them to be small letters? How to do that?
Tuesday, February 28, 2023
Gen match =_n1 replace match = _id if match ==. How can you have missing value ??
Richard Hofler can you help? As I believe you were the author of this code
re post 5 on here https://www.statalist.org/forums/for...score-matching
i am trying to understand this code which the user recommends using after psmatch2 to plot to kdensity curves to identify control when treatment = 0 and dup >1.
i understand that a new variable called match =_n1 where STATA gives value of 1 for 1st observation, 2 for 2nd and so on. So if there are 400 observations the last onservation should be 400.
therefore why should there be a missing value ?
why does the user say if match =. Replace with _id.
how can there be a missing value if the match variable generated is = _n1
the user then goes on to use the code below to identify the duolicates and therefor identify the matched (i think)
i would like to know why the user uses this code as part of his controls to plot a kdensity graph. Its 4am and i’m still thinking about this. I have asked chatgpt who also didnt give me a solution. And emailed several people about this. Appreciate some insignt.
re post 5 on here https://www.statalist.org/forums/for...score-matching
i am trying to understand this code which the user recommends using after psmatch2 to plot to kdensity curves to identify control when treatment = 0 and dup >1.
Code:
gen match=_n1
replace match=_id if match==.
therefore why should there be a missing value ?
why does the user say if match =. Replace with _id.
how can there be a missing value if the match variable generated is = _n1
the user then goes on to use the code below to identify the duolicates and therefor identify the matched (i think)
Code:
duplicates tag match, gen(dup)
Panel Data Logged Differences Help!!
Hello thank you!! I'm doing a research project on whether or not individual CEO campaign contributions affects their 6 month average stock price post election, as compared to their six month average pre election. I have panel data, with multiple observations of pre/post for each company for multiple election years, as seen in the dataex output. I'm trying to run this panel data regression: reghdfe changestockprice totaldem totalrep total_donated towinner, a(companyid year) vce(cluster companyid), but I was informed that it would be a better analysis to make the "change" variable a ln() function to better capture differences across firms. However, sometimes the stock price declined post-election, and the difference is negative. How do I reconcile this with logs? Any and all help is much appreciated!!!
input str8 ticker byte post float(totaldem totalrep companyid changestockprice) long(total_donated towinner tolosers) float year
"AAP" 0 0 1000 1 . 211 1 1 2004
"AAP" 1 0 1000 1 -1.6100006 211 1 1 2004
"AAP" 0 0 1000 1 . 226 1 1 2006
"AAP" 1 0 1000 1 -2.5200005 226 1 1 2006
"AAP" 1 0 1000 1 -9.939999 225 1 1 2008
"AAP" 0 0 1000 1 . 225 1 1 2008
"AAP" 1 0 1000 1 14.23 232 1 1 2010
"AAP" 0 0 1000 1 . 232 1 1 2010
"AAP" 1 0 1000 1 .2099991 235 1 1 2012
"AAP" 0 0 1000 1 . 235 1 1 2012
"AAPL" 0 2300 0 1 . 117 1 1 2002
"AAPL" 1 2300 0 1 -6.25 117 1 1 2002
"AAPL" 0 2300 0 2 . 120 1 1 2004
"AAPL" 1 2300 0 2 -.5 120 1 1 2004
"AAPL" 1 2300 0 2 6.660002 128 1 1 2006
"AAPL" 0 2300 0 2 . 128 1 1 2006
"AAPL" 1 2300 0 2 -5.18 126 1 1 2008
"AAPL" 0 2300 0 2 . 126 1 1 2008
"AAPL" 0 2300 0 2 . 131 1 1 2010
"AAPL" 1 2300 0 2 15.97 131 1 1 2010
"AAPL" 1 2300 0 2 4.1299973 133 1 1 2012
"AAPL" 0 2300 0 2 . 133 1 1 2012
"ABC" 1 3667 10750 2 -5.609997 282 12 35 2002
"ABC" 0 3667 10750 2 . 282 12 35 2002
"ABC" 0 3667 10750 3 . 293 12 35 2004
"ABC" 1 3667 10750 3 5.98 293 12 35 2004
"ABC" 0 3667 10750 3 . 312 12 36 2006
"ABC" 1 3667 10750 3 7.68 312 12 36 2006
"ABC" 0 3667 10750 3 . 315 12 37 2008
"ABC" 1 3667 10750 3 -8.360001 315 12 37 2008
"ABC" 1 3667 10750 3 10.41 323 13 35 2010
"ABC" 0 3667 10750 3 . 323 13 35 2010
"ABC" 0 3667 10750 3 . 326 14 37 2012
"ABC" 1 3667 10750 3 3.369995 326 14 37 2012
ivreg2-weak instrument robust inference
Dear All,
I was a bit confused about the validity of estimates after ivreg2. If the Kleibergen-Paap rk LM statistic and Kleibergen-Paap rk Wald F statistic indicate weak instruments but Anderson-Rubin Wald test and Stock-Wright LM S statistic reject the joint weakness of instruments, are the estimates still valid or not biased by weak instruments? Thank you for any suggestions!
Best,
Haiyan
Dropping observations after the first time the treatment turns off
Hello,
I need some help finding a solution to the following problem:
I want to drop all the observations that occur at and after the first time a treatment turns off (goes from 1 to 0), no matter if it turns on again.
The following table is an example of my data:
I want to drop the following observations: for id 1, drop observations for years 2017 through 2021 as they come at or after the first time treatment turns off (in 2017). Similarly, for id 2, drop observations for years 2016 through 2021, and for id 3, drop observations for years 2020 and 2021.
I am unable to figure this out since the treatment can turn on again for each id and the criterion I set could apply to those observations as well, but I do not want those observations as the treatment has turned off once already.
Any help would be greatly appreciated!
I need some help finding a solution to the following problem:
I want to drop all the observations that occur at and after the first time a treatment turns off (goes from 1 to 0), no matter if it turns on again.
The following table is an example of my data:
| id | year | treatment |
| 1 | 2012 | 0 |
| 1 | 2013 | 1 |
| 1 | 2014 | 1 |
| 1 | 2015 | 1 |
| 1 | 2016 | 1 |
| 1 | 2017 | 0 |
| 1 | 2018 | 0 |
| 1 | 2019 | 1 |
| 1 | 2020 | 1 |
| 1 | 2021 | 0 |
| 2 | 2012 | 0 |
| 2 | 2013 | 0 |
| 2 | 2014 | 1 |
| 2 | 2015 | 1 |
| 2 | 2016 | 0 |
| 2 | 2017 | 0 |
| 2 | 2018 | 0 |
| 2 | 2019 | 1 |
| 2 | 2020 | 1 |
| 2 | 2021 | 1 |
| 3 | 2012 | 0 |
| 3 | 2013 | 0 |
| 3 | 2014 | 0 |
| 3 | 2015 | 0 |
| 3 | 2016 | 0 |
| 3 | 2017 | 1 |
| 3 | 2018 | 1 |
| 3 | 2019 | 1 |
| 3 | 2020 | 0 |
| 3 | 2021 | 0 |
I am unable to figure this out since the treatment can turn on again for each id and the criterion I set could apply to those observations as well, but I do not want those observations as the treatment has turned off once already.
Any help would be greatly appreciated!
EFA-Factor Analysis
Hello,
I have survey data where five main factors and each factor has a set of questions. As we know a number of factors I applied EFA over the data. and got the scores of the latent variables.
My question is: Can I use these scores in regression, where the factor scores will be the dependent variable?
For example, I am getting the following results for a regression where age groups and genders are independent variables and factor scores are dependent in the regression, how to interpret the results? dose it mean older people (Age> 30) negatively answer food insecurity and Resilience questions more than young people (Age<30)? bold means significant and
headers are mean factors we have. I recorded all question scales to int to be able to apply factor analysis( e.g., Agree=1, disagree=0) and so on.
Code:
| Variable | Food Insecurity | Resilience Section | Academic Motivation Section | Mental | Stress Mindset |
| Gender | |||||
| Male | |||||
| Female | -.007601 | .0046041 | .1260862 | .1316824 | .0918349 |
| Age: | |||||
| Age<30 | |||||
| Age_30_50 | -.0228835 | -.0045375 | .0356785 | -.4235363 | -.1060259 |
Monday, February 27, 2023
Intuition on why Fixed-effects models depend on there being variation within the unit of analysis.
I am new to econometrics and tried to find the answer on google, but couldn't find any. I've learned that Fixed-effects models depend on there being variation within each higher-level unit of analysis. For example, if there is no variation within a company's observations, it can't be used in the model.
1. This is probably only for the main predictor variable right? All other control variables wouldn't matter? For example, if company size is the main predictor and I use size fixed effects, if there is no variation in size then STATA will automatically drop those variables?
2. Is this also relevant for continuous variables?
3. In a fixed-effects logistic regression model, you cannot use observations that have no variation on y. Why is it the y variable here not x?
These might be very simple questions for most of you.. but would appreciate if anyone can help!
how to calculate the moving average for a variable
Dear all
I am trying to calculate the average bond maturity over the preceding three months as an instrumental variable in my analysis. it is worth noting that my data is unbalanced and one firm_id can have multiple observations within one year. Therefore, declaring the data as a panel using firm_id would not work. Therefore,
My command is :
xtset observations_num Year
gen matruity_moveavrg=(F1.maturity+maturity+L1.maturit y)/3
the generated new variable is missing and the code is incorrect.
any help is highly appreciated in proving the correct code.
Ask experts for help:how to set the prior of regression coefficients that follow dirichlet distribution in bayes model
Hello, statistics experts,
I have a question that troubles me for long time.
My purpose to estimate the joint effect of air pollution on the risk of birth defects. An random effect logistic model was used and was estimated by bayes method.
The stata programme was showed as following:
bayesmh case = ({a:} + {b}*({w1}*pre3m_pre1m_pm25 + {w2}*pre3m_pre1m_co + {w3}*pre3m_pre1m_so2 + {w4}*pre3m_pre1m_no2 + {w5}*pre3m_pre1m_o3 )), likelihood(logit) ///
define(a: U[code],xb) ///
prior({a:_cons}, normal(-5, 10)) ///
prior({b},normal(0,5)) ///
prior({w1 w2 w3 w4 w5 },dirichlet(1, 1, 1, 1, 1)) ///
prior({var_U}, igamma(0.01,0.01)) ///
block({var_U},gibbs) ///
mcmcsize(5000) dots rseed(1234)
Note: the coefficients {wi} is the weight of different air pollution, w1+....w5=1, and wi should be between 0 and 1. So I set wi as dirichlet distribution.
The results show as following:
| Equal-tailed
| Mean Std. dev. MCSE Median [95% cred. interval]
-------------+----------------------------------------------------------------
a |
_cons | -.6128033 .2640545 .095993 -.6561622 -1.148229 -.1349925
-------------+----------------------------------------------------------------
b | .0005872 .0005011 .000108 .0004688 .0000103 .0017945
w1 | .0709399 .070009 .016397 .0460853 .00433 .2668698
w2 | .2155131 .1589676 .028325 .2030874 .0035754 .5265113
w3 | .2662654 .1226952 .036767 .2907973 .0279012 .4378617
w4 | .1239908 .1079504 .023449 .0927303 .000796 .3904645
w5 | -1.393883 .7596525 .242501 -1.444812 -2.598773 .2032503
var_U | 39.29819 9.156024 1.66255 37.93158 25.63195 62.13184
According the results , the estimation of sum of wi is not equal to 1, w5 is less than 0.
My question is how to set the prior of regression coefficients that follow dirichlet distribution in bayes model? Is the prior setting right in my programme?
Thanks a lot.
Doubt with daily dates and x-axis
Greetings,
I am working with a database and I have two doubts:
1) is there any way that in the x-axis I can only show the year (leaving not visible the month and days). Some time Nick helped me to modify the axis, but I have tried that way and the axis does not look good at all. I used tlabel(, format(%dM/CY)), but as I don't know the STATA number I can't manipulate the axis with the dates.
I would like to do something like what I show you in the attached image
2) the base that I imported already had the dates and STATA recognized it well, but I would like to clone the variable where I have the date and from there pass it to the pure format of STATA and with it I can work in the part of the axes (for example 1/2/2012 -> 18994).
Thanks for your attention colleagues!!!
Code:
clear
input int fecha double tdc
18994 13.9342
18995 13.6882
18996 13.7144
18997 13.7409
18998 13.7228
19001 13.7437
19002 13.6204
19003 13.6592
19004 13.5982
19005 13.6263
19008 13.5401
19009 13.4621
19010 13.3267
19011 13.2516
19012  13.224
19015 13.1383
19016 13.1712
19017 13.1319
19018 12.9325
19019 12.9504
19022 13.0063
19023 13.0077
19024   12.89
19025 12.8038
19026  12.712
19030 12.6472
19031 12.6833
19032   12.72
19033 12.7857
19036 12.7392
19037 12.7753
19038 12.7658
19039 12.8822
19040 12.7856
19043 12.6793
19044 12.7408
19045 12.8296
19046 12.8294
19047 12.8675
19050 12.8779
19051 12.8575
19052 12.7891
19053 12.7764
19054 12.7723
19057 12.8339
19058 12.9777
19059 12.9469
19060  12.784
19061 12.6299
19064  12.715
19065 12.6336
19066 12.6719
19067 12.6591
19068 12.6645
19072 12.6935
19073 12.6833
19074  12.833
19075 12.8035
19078 12.6795
19079 12.6706
19080 12.8039
19081 12.8489
19082 12.8093
19085 12.7691
19086 12.7317
19087 12.8155
19092 12.9902
19093 13.1568
19094 13.1324
19095 13.0736
19096 13.1458
19099 13.2168
19100 13.0816
19101 13.1322
19102 13.2288
19103 13.1171
19106 13.2087
19107 13.1392
19108 13.1667
19109 13.2093
19110 13.0141
19113 12.9942
19115 12.9629
19116 12.9725
19117 13.1344
19120 13.1659
19121 13.3374
19122  13.515
19123  13.447
19124 13.4929
19127 13.6739
19128 13.7302
19129 13.7747
19130 13.7994
19131 13.7809
19134 13.7935
19135 13.7203
19136 14.0335
19137  14.004
19138 14.0156
end
format %tdnn/dd/CCYY fecha

tsset fecha

tsline tdc
multiply vectors; dot product
This is probably very easy, but I don't know how to do it.
1) If part1, part2, part3 in the example below are a vector, I need the dot product of the vector for every pair in every year. Said another way, if person 1 and person 2 (in the below example) are the first pair: I need to multiply (0.33 * 0.2) + (0.33 * 0) + (0.34 * 0.8). I need to do this for all pairwise combinations within the same year. And repeat for all years.
2) Then for each person, within each year, I need to sum their scores from step 1).
The multplying part is easy. Doing it for every pairwise combination and summing across all pairwise combinations for each person within each year is not as easy.
I checked it by hand (after step 2) for person 1 in 2010 and got 0.676. For persons 2 and 3 in 2010, I got 1.018.
Thanks in advance.
1) If part1, part2, part3 in the example below are a vector, I need the dot product of the vector for every pair in every year. Said another way, if person 1 and person 2 (in the below example) are the first pair: I need to multiply (0.33 * 0.2) + (0.33 * 0) + (0.34 * 0.8). I need to do this for all pairwise combinations within the same year. And repeat for all years.
2) Then for each person, within each year, I need to sum their scores from step 1).
Code:
clear
input person year part1 part2 part3
1 2010 .33 .33 .34
2 2010 .2 0 .8
3 2010 .2 0 .8
1 2011 .4 .3 .4
2 2011 .5 .3 .2
3 2011 .1 .2 .7
end
I checked it by hand (after step 2) for person 1 in 2010 and got 0.676. For persons 2 and 3 in 2010, I got 1.018.
Thanks in advance.
Removing Compound Quotes in Local Macro
I am using levelsof to feed a list of ISO-3 country codes into wbopendata to query countries' GDP from the World Bank. wbopendata requires that the list of countries to be queried is in this format:
levelsof gives me an output like this:
I use subinstr() to remove the quotes:
I receive the following result:
which is not what I want. Am I having this issue because of all the compound quotes? I believe I am specifying correctly but clearly that is not the case.
Code:
"ABW;AFG;ALB;ANT"
Code:
`"ABW"';`"AFG"';`"ALB"';`"ANT"'
Code:
local countries = `"`"ABW"';`"AFG"';`"ALB"';`"ANT"'"'
di `"`countries'"'
local countries = subinstr(`"`countries'"', `"""', "", .)
di `"`countries'"'
Code:
. local countries = `"`"ABW"';`"AFG"';`"ALB"';`"ANT"'"'

. di `"`countries'"'
`"ABW"';`"AFG"';`"ALB"';`"ANT"'

. local countries = subinstr(`"`countries'"', `"""', "", .)

. di `"`countries'"'
;;;
No observation error when creating new variables
Dear Stata users!
I am having a problem and looking forward to your help. You can see one part of my data set as below. I am using nested logit model and need to classify 50 altenatives(province_name) into 6 nests (Red River Delta, North Midlands, North Centrals, Central Higlands, South East, Mekong River) by creating a new variable "type".
In order to do this, my code is:
nlogitgen type=province_name (Red River Delta: Vinhphuc province|Quangninh province|Hungyen prvince|Haiduong province|Hanam province|Haiphong city|Ninhbinh province|Hanoi city|Bacninh province|Namdinh province|Thaibinh province, North Midlands: Phutho province| Thainguyen province|Bacgiang province|Backan province|Yenbai province|Langson province|Hoabinh province, North Centrals: Quangnam province|Quangngai province|Thanhhoa province|Phuyen province|Danang city|Nghean province |Khanhhoa province|Binhthuan province|Hatinh province|Quangbinh province|Quangtri province|Thuathienhue province|Binhdinh province, Central Highlands: Lamdong province, South East: Binhphuoc province|Dongnai province|Tayninh province|Hochiminh city|Binhduong province| Ba Ria -Vung Tau, Mekong River: Bentre province|Dongthap province|Longan province|Vinhlong province|Tiengiang province|Travinh province|Angiang province|Kiengiang province|Cantho city|Haugiang province|Soctrang province|Baclieu province)
I follow the example in page 8-11 of this link: cmnlogit.pdf (stata.com)
However, I got the error: no observations for province_name == Vinhphuc
r(198);
Here is my data sample.
I then tried to fix by converting province_name from string to numeric by using command: encode province_name, gen(province) and run similar command.
nlogitgen type=province(Red River Delta: Vinhphuc province|Quangninh province|Hungyen prvince|Haiduong province|Hanam province|Haiphong city|Ninhbinh province|Hanoi city|Bacninh province|Namdinh province|Thaibinh province, North Midlands: Phutho province| Thainguyen province|Bacgiang province|Backan province|Yenbai province|Langson province|Hoabinh province, North Centrals: Quangnam province|Quangngai province|Thanhhoa province|Phuyen province|Danang city|Nghean province |Khanhhoa province|Binhthuan province|Hatinh province|Quangbinh province|Quangtri province|Thuathienhue province|Binhdinh province, Central Highlands: Lamdong province, South East: Binhphuoc province|Dongnai province|Tayninh province|Hochiminh city|Binhduong province| Ba Ria -Vung Tau, Mekong River: Bentre province|Dongthap province|Longan province|Vinhlong province|Tiengiang province|Travinh province|Angiang province|Kiengiang province|Cantho city|Haugiang province|Soctrang province|Baclieu province)
but still get the error
(value label dereference "Vinhphuc":province not found)
no observations for province == Vinhphuc
r(198);
I really look forward to your help.
Thanks a lot.
Sophie.
I am having a problem and looking forward to your help. You can see one part of my data set as below. I am using nested logit model and need to classify 50 altenatives(province_name) into 6 nests (Red River Delta, North Midlands, North Centrals, Central Higlands, South East, Mekong River) by creating a new variable "type".
In order to do this, my code is:
nlogitgen type=province_name (Red River Delta: Vinhphuc province|Quangninh province|Hungyen prvince|Haiduong province|Hanam province|Haiphong city|Ninhbinh province|Hanoi city|Bacninh province|Namdinh province|Thaibinh province, North Midlands: Phutho province| Thainguyen province|Bacgiang province|Backan province|Yenbai province|Langson province|Hoabinh province, North Centrals: Quangnam province|Quangngai province|Thanhhoa province|Phuyen province|Danang city|Nghean province |Khanhhoa province|Binhthuan province|Hatinh province|Quangbinh province|Quangtri province|Thuathienhue province|Binhdinh province, Central Highlands: Lamdong province, South East: Binhphuoc province|Dongnai province|Tayninh province|Hochiminh city|Binhduong province| Ba Ria -Vung Tau, Mekong River: Bentre province|Dongthap province|Longan province|Vinhlong province|Tiengiang province|Travinh province|Angiang province|Kiengiang province|Cantho city|Haugiang province|Soctrang province|Baclieu province)
I follow the example in page 8-11 of this link: cmnlogit.pdf (stata.com)
However, I got the error: no observations for province_name == Vinhphuc
r(198);
Here is my data sample.
Code:
* Example generated by -dataex-. To install: ssc install dataex
clear
input str10 tax_code str2 province_code float province_chosen str22 province_name
"0101744855" "31" 0 "Haiphong city"
"0101744855" "27" 0 "Bacninh province"
"0101744855" "30" 0 "haiduong province"
"0101744855" "22" 0 "Quangninh province"
"0101744855" "34" 0 "Thaibinh province"
"0101744855" "54" 0 "Phuyen province"
"0101744855" "26" 0 "Vinhphuc province"
"0101744855" "01" 1 "Hanoi city"
"0101744855" "86" 0 "Vinhlong province"
"0101744855" "35" 0 "Hanam province"
"0101744855" "19" 0 "Thainguyen province"
"0101744855" "37" 0 "Ninhbinh province"
"0101744855" "80" 0 "Longan province"
"0101744855" "87" 0 "Dongthap province"
"0101744855" "24" 0 "Bacgiang province"
"0101744855" "83" 0 "Bentre province"
"0101744855" "72" 0 "Tayninh province"
"0101744855" "82" 0 "Tiengiang province"
"0101744855" "06" 0 "Backan province"
"0101744855" "68" 0 "Lamdong province"
"0101744855" "36" 0 "namdinh province"
"0101744855" "77" 0 "Baria-vungtau province"
"0101744855" "74" 0 "Binhduong province"
"0101744855" "49" 0 "Quangnam province"
"0101744855" "79" 0 "Hochiminh city"
"0101744855" "33" 0 "Hungyen prvince"
"0101744855" "48" 0 "Danang city"
"0101744855" "40" 0 "Nghean province"
"0101744855" "25" 0 "Phutho province"
"0101744855" "51" 0 "Quangngai province"
"0101744855" "38" 0 "Thanhhoa province"
"0101744855" "75" 0 "Dongnai province"
"0101744855" "70" 0 "Binhphuoc province"
"0107952393" "40" 0 "Nghean province"
"0107952393" "37" 0 "Ninhbinh province"
"0107952393" "31" 0 "Haiphong city"
"0107952393" "22" 0 "Quangninh province"
"0107952393" "83" 0 "Bentre province"
"0107952393" "01" 1 "Hanoi city"
"0107952393" "30" 0 "haiduong province"
"0107952393" "19" 0 "Thainguyen province"
"0107952393" "36" 0 "namdinh province"
"0107952393" "48" 0 "Danang city"
"0107952393" "68" 0 "Lamdong province"
"0107952393" "75" 0 "Dongnai province"
"0107952393" "70" 0 "Binhphuoc province"
"0107952393" "35" 0 "Hanam province"
"0107952393" "86" 0 "Vinhlong province"
"0107952393" "27" 0 "Bacninh province"
"0107952393" "51" 0 "Quangngai province"
"0107952393" "79" 0 "Hochiminh city"
"0107952393" "87" 0 "Dongthap province"
"0107952393" "33" 0 "Hungyen prvince"
"0107952393" "80" 0 "Longan province"
"0107952393" "38" 0 "Thanhhoa province"
"0107952393" "25" 0 "Phutho province"
"0107952393" "26" 0 "Vinhphuc province"
"0107952393" "82" 0 "Tiengiang province"
"0107952393" "06" 0 "Backan province"
"0107952393" "49" 0 "Quangnam province"
"0107952393" "54" 0 "Phuyen province"
"0107952393" "24" 0 "Bacgiang province"
"0107952393" "77" 0 "Baria-vungtau province"
"0107952393" "74" 0 "Binhduong province"
"0107952393" "72" 0 "Tayninh province"
"0107952393" "34" 0 "Thaibinh province"
"0107997813" "72" 0 "Tayninh province"
"0107997813" "49" 0 "Quangnam province"
"0107997813" "54" 0 "Phuyen province"
"0107997813" "86" 0 "Vinhlong province"
"0107997813" "24" 0 "Bacgiang province"
"0107997813" "31" 0 "Haiphong city"
"0107997813" "38" 0 "Thanhhoa province"
"0107997813" "30" 0 "haiduong province"
"0107997813" "34" 0 "Thaibinh province"
"0107997813" "68" 0 "Lamdong province"
"0107997813" "27" 0 "Bacninh province"
"0107997813" "83" 0 "Bentre province"
"0107997813" "37" 0 "Ninhbinh province"
"0107997813" "06" 0 "Backan province"
"0107997813" "75" 0 "Dongnai province"
"0107997813" "74" 0 "Binhduong province"
"0107997813" "01" 1 "Hanoi city"
"0107997813" "22" 0 "Quangninh province"
"0107997813" "19" 0 "Thainguyen province"
"0107997813" "36" 0 "namdinh province"
"0107997813" "25" 0 "Phutho province"
"0107997813" "70" 0 "Binhphuoc province"
"0107997813" "33" 0 "Hungyen prvince"
"0107997813" "82" 0 "Tiengiang province"
"0107997813" "40" 0 "Nghean province"
"0107997813" "51" 0 "Quangngai province"
"0107997813" "48" 0 "Danang city"
"0107997813" "80" 0 "Longan province"
"0107997813" "26" 0 "Vinhphuc province"
"0107997813" "77" 0 "Baria-vungtau province"
"0107997813" "35" 0 "Hanam province"
"0107997813" "87" 0 "Dongthap province"
"0107997813" "79" 0 "Hochiminh city"
"0108058196" "70" 0 "Binhphuoc province"
end
nlogitgen type=province(Red River Delta: Vinhphuc province|Quangninh province|Hungyen prvince|Haiduong province|Hanam province|Haiphong city|Ninhbinh province|Hanoi city|Bacninh province|Namdinh province|Thaibinh province, North Midlands: Phutho province| Thainguyen province|Bacgiang province|Backan province|Yenbai province|Langson province|Hoabinh province, North Centrals: Quangnam province|Quangngai province|Thanhhoa province|Phuyen province|Danang city|Nghean province |Khanhhoa province|Binhthuan province|Hatinh province|Quangbinh province|Quangtri province|Thuathienhue province|Binhdinh province, Central Highlands: Lamdong province, South East: Binhphuoc province|Dongnai province|Tayninh province|Hochiminh city|Binhduong province| Ba Ria -Vung Tau, Mekong River: Bentre province|Dongthap province|Longan province|Vinhlong province|Tiengiang province|Travinh province|Angiang province|Kiengiang province|Cantho city|Haugiang province|Soctrang province|Baclieu province)
but still get the error
(value label dereference "Vinhphuc":province not found)
no observations for province == Vinhphuc
r(198);
I really look forward to your help.
Thanks a lot.
Sophie.
Marginal Effects after Firthlogit
Dear Statalists,
I have used mfx command after estimating firthlogit model, and the predicted Y shows negative (-1.199). The results are given below.
Array
So I have converted firthlogit to logit and then used mfx command as given below. Predicted Y is now positive and less than 1, but the marginal coefficients have changed. Can I use these coefficients and predicted Y for my thesis?
.
. tempname B
.
. matrix define `B' = e(b)
.
. quietly logit mobilemoney female age agesq secondary tertiary incq1 incq2 incq3 incq4 employ rural mobileowner internetaccess wages transfers utilities remittance, asis iterate(0) from(`B', copy)
.
Array
Sunday, February 26, 2023
Panel Regression Help!!
Hi all!!
Firstly, thank you for reading/helping! I'm attempting a project on looking at CEO personal campaign contributions before the 2002 election, and seeing if that changed their stock price (pre/post 6 month average). I have an output of my dataex for the format of the data, and after some dataset transformation/manipulation, this is the final result I have. I'm curious as to what the best regression would be to use? Regular reg, or should I use areg? I was originally going to use, "reg changestockprice totalrep if post == 1 i.companyid, robust" but I also want to loop through other variables, like totaldem and towinners, for example. How would I go about writing a loop for that, and then making a table to append all of those regressions together? Apologies for the longer post, kind of stumped as to where to go from here, and also fix the collinearity problem I ran into when I ran the first regression previously mentioned. Any and all help would be so so appreciated!! Thank you!
Array
How to estimate the trade creation and diversion effects with exporter-impoter-specific time trend?
Hello guys in Statalist!
I have some problems with estimation on trade creation and diversion effects. I am using the command ppml_panel_sg with trend options. That means the model includes it jt and ij fixed effects as well as a exporter-importer-specific time trend.
Now I would like to estimate the Trade Creation and Trade Diversion effect, and I set two "single member" dummies to indicate whether source country (i) and destination country (j) is a member of the trade agreement (BRI) respectively. In other words, BRI_i takes value of 1 if i is a member and j is not, zero otherwise. BRI_j takes value of 1 if i is not a member and j is a member, zero otherwise. When I estimate these two dummies, one of them will be omitted due to collinearity.
I find some papers mention that to address the collinearity issue we need to drop the exporter-year(it) and importer-year(jt) FE. My question is that how to estimate these two "single member" dummies excluding it and jt FE. Is it possible to use ppml_panel_sg command? Or I need to use command ppmlhdfe? If so, it seems there is no option to add this exporter-importer-specific time trend in ppmlhdfe command, then how to set this variable?
Thanks everyone in advance!
Panel Data Help! Creating a Change Variabel
Hello! This is my first post and very much in need of help with a project I've been working on for some time. I have a panel dataset for CEO campaign contributions, some company info, how much they donated to democrats in the 6 months prior to an election (midterm 2002 election), then _2002_ variable is the six month average stock price. Here is the dataex output, with the post variable corresponding to one of the two instances for each company for the 6 months pre/post the election date. I am trying to answer the question of how much an individual CEO donates to a campaign affects their stock price after an election - and for my regression I need a change variable for pre/post for _2002_, but have run into error when I run "by companyid: gen changestockprice = (_2002_ if post == 2) - (_2002 if post== 1)"
Any help would be greatly appreciated !!! Thank you!!
dataex:
input str43 corpname str8 ticker float(companyid totaldem) double _2002_ byte post
"Apple Inc" "AAPL" 1 2300 57.79999923706055 1
"Apple Inc" "AAPL" 1 2300 51.54999923706055 2
"Amerisourcebergen Corp" "ABC" 2 3667 54.5099983215332 1
"Amerisourcebergen Corp" "ABC" 2 3667 48.90000152587891 2
"Abbott Laboratories" "ABT" 3 15450 50.2599983215332 1
"Abbott Laboratories" "ABT" 3 15450 43.65000152587891 2
"Archer-Daniels-Midland Co" "ADM" 4 2000 53.54999923706055 1
"Archer-Daniels-Midland Co" "ADM" 4 2000 49.7400016784668 2
"Automatic Data Processing" "ADP" 5 700 51.54999923706055 1
"Automatic Data Processing" "ADP" 5 700 59.47999954223633 2
"Ameren" "AEE" 6 11450 53.23714229038784 1
"Ameren" "AEE" 6 11450 48.370000566755024 2
"American Electric Power Co Inc" "AEP" 7 28820 53.23714229038784 1
"American Electric Power Co Inc" "AEP" 7 28820 15.5 2
dataex (picture screengrab):
Array
Replace values of string variables based on a fraction of my dataset
Hello. I'm using a mapping table linking a question (varname) to its short label (label) in a survey. Whenever the question refers to a specific individual, the id of this individual is mentioned in its label. For instance, the question C2O for the individual A1 will be C2U_A1 on Stata. However, for a reason that has nothing to do with my problem here, I had to completely change the IDs of the individuals, and I would like to change the values of the label variable based on the new ID. Here's a fraction of my dataset :
As you can see the old_id denotes the old individual id. I would like to change the value of old_id to the new one in new_id. This is easy and I know how to do this, for example by concatenating strings with variable contents using replace label = "C2O" + id + "_". However my dataset is a weird mix of appended dataset, variables gotten from frames and it is really not consistent. So for another set of questions such as, C3O I have missing values. Now, I would like a code that would, no matter where I am in the dataset, replace the value of old_id by the one in id based on the question C2O. I'm not sure if it's clear so I'm ready to give further details If needed. Thank you everyone for your time !
Code:
* Example generated by -dataex-. For more info, type help dataex
clear
input str15 label str3 new_id str5 old_id
"C2O_O1_"  "E1"  "O1"
"C2O_O2_"  "E2"  "O2"
"C2O_O3_"  "E3"  "O3"
"C2O_O4_"  "E4"  "O4"
"C2O_O32_" "E0"  "O32"
"C2O_O5_"  "E5"  "O5"
"C2O_O6_"  "E7"  "O6"
"C2O_O7_"  "E8"  "O7"
"C2O_O8_"  "E9"  "O8"
"C2O_O9_"  "E10" "O9"
"C3O_O1_SQ003_"  "" ""
"C3O_O1_SQ001_"  "" ""
"C3O_O1_SQ002_"  "" ""
"C3O_O11_SQ003_" "" ""
"C3O_O11_SQ001_" "" ""
"C3O_O11_SQ002_" "" ""
"C3O_O18_SQ003_" "" ""
"C3O_O18_SQ001_" "" ""
"C3O_O18_SQ002_" "" ""
"C3O_O19_SQ003_" "" ""
end
meglm
Hello All,
I have two datasets, one with a binary outcome and the second with a count outcome.
I have difficulty importing the two datasets to Stata because each dataset has different sheets in excel, and also, two different numbers of observations for each dataset.
Can I use this code for two different datasets? and how?
HTML Code:
meglm thk prethk cc##tv || school: || class:, family(Poisson) link(logit)
Descriptive statistics with imputed data base
Hi Statalisters,
I am doing my Master's thesis with an imputed database. A doubt has arisen for me when trying to generate descriptive statistics. I have previously read about the misum command, which I have used with a continuous variable (RESULT_GAD7_pre), although I have used it without including an independent variable. I have also read that I can know the mean of the continuous dependent variable (example: RESULT_GAD7_pre) as a function of an independent variable (control and intervention/CI groups) by using the command mi estimate: regress. How could I know what are the descriptives - e.g. mean, standard deviation, minimum, maximum, etc. - of my dependent variable RESULT_GAD7_pre as a function of my independent variable CI? What would be the way to introduce this independent variable in the misum command RESULT_GAD7_pre? Thanks in advance. Have a nice day.
I am doing my Master's thesis with an imputed database. A doubt has arisen for me when trying to generate descriptive statistics. I have previously read about the misum command, which I have used with a continuous variable (RESULT_GAD7_pre), although I have used it without including an independent variable. I have also read that I can know the mean of the continuous dependent variable (example: RESULT_GAD7_pre) as a function of an independent variable (control and intervention/CI groups) by using the command mi estimate: regress. How could I know what are the descriptives - e.g. mean, standard deviation, minimum, maximum, etc. - of my dependent variable RESULT_GAD7_pre as a function of my independent variable CI? What would be the way to introduce this independent variable in the misum command RESULT_GAD7_pre? Thanks in advance. Have a nice day.
Invalid Syntax r198
Hi everyone,
I'm having issues with a couple of my recoding commands and wonder if you could help.
I need to recode categorical variables, and have managed to successfully recode one of them, but the next ones have both had the same invalid syntax r198 error, but I cant figure out why.
I have attached a picture of my commands, the first one works, and the second two both come up with invalid syntax.
Array
Thanks so much for any help!
Daisy
Comparing Slopes
Hi there,
In a trend analysis, I am looking at whether hours worked changed across 15 years. Then I am seeing whether hours worked differs by 4 age groups. I already have coefficients (with p-values) for change in hours from baseline to each successive year, but I would like to see whether there is a significant differences between the slopes of each group (i.e. test whether the slopes for two [or more] independent populations are equal). Any ideas how to do this in Stata?
Thanks in advance for your help!
In a trend analysis, I am looking at whether hours worked changed across 15 years. Then I am seeing whether hours worked differs by 4 age groups. I already have coefficients (with p-values) for change in hours from baseline to each successive year, but I would like to see whether there is a significant differences between the slopes of each group (i.e. test whether the slopes for two [or more] independent populations are equal). Any ideas how to do this in Stata?
Code:
input float(m_yr m_yrqtr2) double m_hrsov_a float m_age_c
2007 20071   41 3
2007 20071    . 4
2007 20071    . 1
2007 20071    . 3
2007 20071    . 2
2007 20071    . 4
2007 20071    . 3
2007 20071    . 3
2007 20071    . 1
2007 20071    . 3
2007 20071   46 2
2007 20071    . 2
2007 20071    . 1
2007 20071    . 4
2007 20071    . 3
2007 20071    . 2
2007 20071   60 3
2007 20071    . 3
2007 20071    . 4
2007 20071    . 3
2007 20071    . 2
2007 20071    . 2
2007 20071    . 1
2007 20071    . 1
2007 20071    . 2
2007 20071    . 1
2007 20071    . 4
2007 20071   40 2
2007 20071    . 3
2007 20071    . 3
2007 20071    . 3
2007 20071    . 1
2007 20071    . 3
2007 20071    . 3
2007 20071    . 4
2007 20071    . 4
2007 20071 40.5 2
2007 20071    . 2
2007 20071    . 1
2007 20071    . 4
2007 20071    . 2
2007 20071    . 4
2007 20071    . 1
2007 20071    . 2
2007 20071   48 3
2007 20071   55 3
2007 20071    . 2
2007 20071    . 4
2007 20071 25.5 4
2007 20071    . 3
2007 20071    . 2
2007 20071    . 3
2007 20071    . 3
2007 20071    . 2
2007 20071    . 2
2007 20071   56 2
2007 20071    . 2
2007 20071    . 2
2007 20071    . 3
2007 20071   36 4
2007 20071    . 4
2007 20071   50 3
2007 20071    . 2
2007 20071   46 3
2007 20071    . 4
2007 20071    . 4
2007 20071    . 2
2007 20071    . 1
2007 20071    . 4
2007 20071   28 3
2007 20071    . 2
2007 20071    . 4
2007 20071    . 2
2007 20071    . 2
2007 20071    . 2
2007 20071    . 2
2007 20071    . 2
2007 20071    . 1
2007 20071    . 4
2007 20071   40 2
2007 20071    . 2
2007 20071    . 4
2007 20071    . 1
2007 20071    . 3
2007 20071    . 3
2007 20071    . 3
2007 20071    . 3
2007 20071   27 3
2007 20071    . 2
2007 20071    . 1
2007 20071    . 1
2007 20071    . 2
2007 20071   50 2
2007 20071   45 3
2007 20071   40 3
2007 20071   46 4
2007 20071    . 3
2007 20071    . 2
2007 20071    . 2
2007 20071    . 4
end
label values m_yr m_yrla
label values m_hrsov_a m_hrsov_ala
label values m_age_c m_age_cla
label def m_age_cla 1 "Gen. Z", modify
label def m_age_cla 2 "Millennials", modify
label def m_age_cla 3 "Gen. X", modify
label def m_age_cla 4 "Baby Boomers", modify
Stratified cluster sampling
Hello everyone
I have census data for 115 400 companies in a city. There are 24 municipalities in the city grouped into 4 districts. I intend to select 400 sample units for my study using stratified cluster sampling as follows:
City —> 24 clusters (municipalities) → 4 Strata (districts) → randomly select 200 units from each stratum → from the 800 companies selected→ make 2 clusters (formal and informal companies)--> randomly select 400 units. How do I go about it? It’s all about selecting a sample from a dataset using stratified cluster sampling techniques. I am using Stata 17 on windows. I would appreciate it if you could help. With sincere gratitude.
Saturday, February 25, 2023
How to add an extra year to an existing dataset
Dear members
I have a dataset spanning from 2005-2019 and I would like to add 2004 to the year variable by company_id to append the 2004 companies data to the existing dataset.
what’s stata command to achieve the above task ?
thanks
I have a dataset spanning from 2005-2019 and I would like to add 2004 to the year variable by company_id to append the 2004 companies data to the existing dataset.
what’s stata command to achieve the above task ?
thanks
Estadd local not working
Hello,
I'm using Stata17MP on Windows 11.
I'm trying to use estadd local but it's not working. In particular, I do not get any specific error code when doing this. However, nothing happens to my output table once I type the estadd local. The puzzling thing is that the exact same code was working fine on this same machine a few weeks ago.
Does anyone have any idea of why this is happening?
How to calculate Point Estimates in a regression
Dear All;
Need your kind help. I have a file tea_data.csv (attached for reference). I generated the variable teaDum, which takes value 1 if any amount of tea is sown and 0 otherwise. I further generated the variable post, which takes a value of 1 if the cohort is born on or after 1979. I then generated the interaction term using #, however I am required to provide the point estimate which I am unable to figure.
Kindly help.
Regards
Friday, February 24, 2023
help with Synthetic control
hello everyone.
Ive compiled data on a large amount of countries to perform synthetic control.
yesterday i was running synthetic control on life expectancy with my control variables being GDP GNI population and unemployment. This was working. then I wanted to perform synthetic control on homicides with the same controls as this is what i was mainly interested in. Since there were gaps in my homicide data the code wouldn't run. So today i collected a bunch of homicide data with countries that had no gaps. yet when i run my synth command shown below
synth homicide GDP GNI Population Unemployement, trunit (32) trperiod(2016) xperiod(2005(1)2015) nested fig
i get
First Step: Data Setup
-------------------------------------------------------------------------------------------
St: operator invalid
r(198);
and the code doesnt run.
attached below are the two excel sheets. The first one will run synthetic control on life expectancy the new synthetic control sheet is the one that is giving me the operator invalid.
i can load both data sets in stata and am able to get them balanced by typing tsset Country Year
any help would be very much appreciated.
Working with Stata dates
Hello,
I would like to create a variable, called "outcome", measured as a dummy indicator equal to one if Plan B was implemented (variable Plan B = 1) within 30 days from the implementation of Plan A (variable Plan A = 1). Note that within an id, there could be multiple plans A and B. I send an example of the dataset below. Thank you very much in advance.
I would like to create a variable, called "outcome", measured as a dummy indicator equal to one if Plan B was implemented (variable Plan B = 1) within 30 days from the implementation of Plan A (variable Plan A = 1). Note that within an id, there could be multiple plans A and B. I send an example of the dataset below. Thank you very much in advance.
Code:
* Example generated by -dataex-. For more info, type help dataex
clear
input byte id str9 date byte(plan_A plan_B outcome)
1 "21-Jan-14" 0 0 0
1 "8-Jul-14"  0 1 0
1 "5-Aug-14"  1 0 0
1 "1-Sep-14"  0 1 1
1 "5-Mar-15"  0 0 0
1 "28-Nov-15" 0 0 0
1 "5-Sep-17"  1 0 0
1 "2-Nov-17"  0 1 0
2 "21-Mar-15" 0 0 0
2 "10-Apr-15" 1 0 0
2 "20-Apr-15" 0 1 1
2 "19-Dec-16" 0 1 0
2 "11-Jan-17" 0 0 0
2 "3-Jul-17"  0 0 0
end
Help creating a bar graph over multiple variables
Greetings,
When creating a graph bar and dividing it over a variable, I cant figure out a way to add in the same graph a bar for the whole dataset. Something like this:
Array
I have tried creating a variable "whole" and use the over two times when generating the graph but that doesnt seem to work.
Here, una_tic and todas_tic are the variables im interested on taking the mean of. area_estudio is the variable that divides my dataset
Any help is appreciated
Mateo Podesta
When creating a graph bar and dividing it over a variable, I cant figure out a way to add in the same graph a bar for the whole dataset. Something like this:
Array
I have tried creating a variable "whole" and use the over two times when generating the graph but that doesnt seem to work.
Code:
gen whole = 1
graph bar una_tic todas_tic, over(area_estudio) over(whole)
Any help is appreciated
Mateo Podesta
Trouble working with %tc dates
Hello,
I have a variable "EndDate" whose format is double yet displays as if it was %tc. I need to identify the maximum date by categories of the group "id" using this variable. After formatting the variable to %tc, the "bys id: egen max" function calculates a different %tc date compared to any of the original dates within any single id. I haven't been able to solve the problem. Thank you.
format EndDate %tc
bys id: egen maxenddate=max(EndDate)
format maxenddate %tc
id EndDate maxenddate
1 01feb2023 10:51:32 01feb2023 18:00:33
1 01feb2023 18:00:14 01feb2023 18:00:33
1 31jan2023 06:45:08 01feb2023 18:00:33
Loop
Hello fellow Stata users,
I have a question regarding the forvalues loop, this is the first time I want to use it. I have a variable called "Distmetro" which is the distance to the metro.
The question that needs to be answered is this:
"Now we want to estimate the marginal effect of distmetro for the non-parametric and semi-parametric models. Repeat this approximation for various distances and do this for both the non-parametric and semiparametric estimation. For example, 100m, 200m, 400m, 600m, 1000m, 2000m, 3000m. Tip: It may be useful to code a loop."
I appreciate any help how someone could help me produce the forvalues function!
I have a question regarding the forvalues loop, this is the first time I want to use it. I have a variable called "Distmetro" which is the distance to the metro.
The question that needs to be answered is this:
"Now we want to estimate the marginal effect of distmetro for the non-parametric and semi-parametric models. Repeat this approximation for various distances and do this for both the non-parametric and semiparametric estimation. For example, 100m, 200m, 400m, 600m, 1000m, 2000m, 3000m. Tip: It may be useful to code a loop."
Code:
* Example generated by -dataex-. For more info, type help dataex
clear
input double distmetro
 458.2579040527344
1916.4649658203125
 1843.400146484375
2018.2406005859375
 2277.740478515625
    370.2373046875
1131.3287353515625
     1156.41015625
 309.6813049316406
 564.4126586914063
   1433.2822265625
 1289.849365234375
 1385.840087890625
  1223.51025390625
1727.3624267578125
1923.1534423828125
 2043.496337890625
 1678.600830078125
  1565.65380859375
1584.6746826171875
1998.6033935546875
 371.5183410644531
505.54559326171875
 640.9423217773438
 640.9423217773438
1321.6929931640625
    1045.044921875
 2019.236083984375
 398.2286376953125
 1255.669189453125
 2103.856201171875
 2463.675537109375
 2357.287353515625
 1195.438720703125
1594.8824462890625
119.31536102294922
 403.8852233886719
  1725.53662109375
1744.9683837890625
 1658.052001953125
 1793.210205078125
 712.0525512695313
1101.7047119140625
 2019.236083984375
 1721.634521484375
1321.6605224609375
 911.4725341796875
 832.2876586914063
 564.3883666992188
     619.013671875
277.81719970703125
 394.5236511230469
  564.499267578125
1278.1434326171875
1095.9532470703125
 2109.886962890625
  2057.14208984375
   2064.8876953125
  2503.75927734375
  2194.31689453125
      1194.3828125
  3533.34326171875
362.93072509765625
 535.9008178710938
  1396.98291015625
312.04754638671875
 497.8690185546875
 969.5977783203125
 1773.638916015625
1527.2176513671875
  2009.80126953125
1769.6451416015625
 2100.688232421875
 1947.579833984375
 1914.360595703125
    2083.279296875
   2499.2138671875
 2436.013427734375
 972.3533325195313
1372.7518310546875
 176.5154266357422
 976.3056030273438
 1399.171630859375
   1081.5009765625
       1542.015625
1053.1322021484375
1044.7945556640625
 465.8895568847656
 993.1671752929688
 993.1671752929688
    1260.998046875
1839.2691650390625
     1806.71484375
1786.1949462890625
 2439.008544921875
  2524.68505859375
  2593.27587890625
 753.3658447265625
 690.3713989257813
1591.0655517578125
endMeta proportion
Hi to everybody...
after running the "metaprop" command if it is possible to write instead of "ES" "Proportion"?
Thanks to everybody
after running the "metaprop" command if it is possible to write instead of "ES" "Proportion"?
Code:
metaprop Casis Totalautism, random cimethod(exact) label(namevar=Study)
Thursday, February 23, 2023
Regression of a few selected observations
I have a set of data but would only require to use of a few observations from the entire dataset. I was wondering if there is an easier way I can select the observations I want to be used in my regression than me keeping them one by one.
Thank you
Thank you
Urgent: Multilevel moderated mediation
I need to estimate a multilevel moderated mediation model, but I can't find the right code for it. I was hoping someone can help me with the syntax. The group variable is country, the outcome variable is wellbeing, the independent variable is female, the control variables are education and income, the mediator is emotions, the moderators are social stability and economic stability (3 way interaction). Social stability and Economic stability are level 2 variables while the rest are level 1. Can someone please provide the syntax? I attached a screenshot of the model. Andrew Musau Clyde Schechter
Array
Array
Concordance, sensitivity, specificity
Hello,
I have a very small data set with two diagnostic test data. One is an old test and gold standard and we want to test how good the new test is at diagnosing the same disease. Should I calculate the specificity, sensitivity, NPV, PPV, AUC or concordance? There are so many tests.
----------------------- copy starting from the next line -----------------------
------------------ copy up to and including the previous line ------------------
So far, I have used this code in Stata but I am not sure why it says "True D defined as newtest ~= 0 ", shouldn't the disease be defined by 1?
diagtest oldtest newtest
Array
I have a very small data set with two diagnostic test data. One is an old test and gold standard and we want to test how good the new test is at diagnosing the same disease. Should I calculate the specificity, sensitivity, NPV, PPV, AUC or concordance? There are so many tests.
----------------------- copy starting from the next line -----------------------
Code:
* Example generated by -dataex-. For more info, type help dataex
clear
input byte(id oldtest newtest)
1 1 1
2 1 1
3 1 0
4 0 0
5 1 1
6 0 0
7 0 0
8 0 1
9 1 1
end
So far, I have used this code in Stata but I am not sure why it says "True D defined as newtest ~= 0 ", shouldn't the disease be defined by 1?
diagtest oldtest newtest
Array
How can I Correctly Build the Fixed Effects Multinominal Logistic Regression Model with Panel Data?
Hello,
I ran into difficulties when building fixed effects Multinominal Logistic Regression Model with Panel Data using Stata.
The dataset is a longitudinal and the variable "StudentID‘’ is nested within the variable "SchoolID".
Meanwhile, each student was measured multiple times and the variable "time" is in the dataset.
My boss wants me to do a fixed effect multinominal logistic regression model for him and he said he knew nothing about it. (His boss asked him to do this)
The 1st question is when using xtset command, for this dataset, I should use xtset studentID or xtset studentID time or xtset schoolID?
The 2nd question is when buidling the requested fixed effect model,
what command I should use?
xtmlogit depvar indvar1 indvar2 indvar3 indvar1#indvar2, fe vce(cluster schoolID) rrr is correct?
when adding (cluster schoolID) into the model, the error message said, "groups are not nested within clusters".
Thank you for your help.
Wednesday, February 22, 2023
) required
Hello, I am writing a code to plot a difference in differences, I have the following:
twoway (scatter price_index Year if Treatment == 1, msymbol(O) mcolor(blue)) ////
(scatter price_index Year if Treatment == 0, msymbol(O) mcolor(red)) ////
legend(label(1 "Treatment") label(2 "Control")) ///
ytitle("Price index") xtitle("Year") ///
vertical(2021, lpattern(dash)) ///
title("Price Index Chart by Treatment")
But when I run the code I get the error ") required". Honestly, I can't see where I'm missing the ")". I would really appreciate your help.
Regards.
WeWork Porter’s Five Forces Analysis
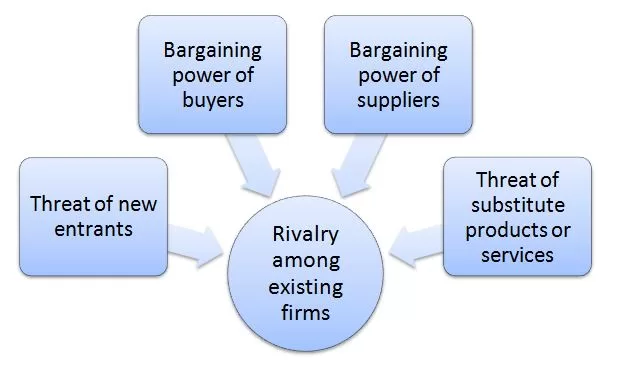 Porter’s Five Forces analytical framework developed by Michael Porter (1979)[1] represents five individual forces that shape an overall extent of competition in the industry. WeWork Porter’s Five Forces is illustrated in figure below: Porter’s Five Forces Threat of new entrants in WeWork Porter’s Five Forces Analysis Threat of new entrants into the flexible workspace industry is significant. The following are the major factors that affect the threat of new entrants into the flexible workspace industry. 1. Time of entry. Increasing numbers of start-ups and solopreneurs are increasing demand for flexible workspace. Furthermore, COVID-19 pandemic has proved the inefficiency of committing to long-term traditional real estate lease agreements for many businesses. Instead, companies of all sizes increasingly prefer to flexible workspace to accommodate their changing needs for desks throughout the year. This tendency may motivate new players to enter the industry. 2. Massive capital requirements. Leasing real estate and furnishing them into creative open space is expensive. Investors may not be keen to finance such business proposals due to low profit margins and long payback periods of their investment. Massive capital requirement is a serious barrier for new entrants. WeWork’s co-founder and former CEO Adam Neumann was able to raise billions of dollars for the business by positioning the company as an internet technology company, rather than real estate company it is. 3. Lack of technological barrier. Unlike technological and manufacturing businesses there are no know-how barriers to enter the flexible workspace industry. There is no secret formula or advanced software a company needs to develop to enter the industry. Massive capital requirement is the only barrier and the absence of other barriers may attract new players into the industry. Bargaining power of buyers in WeWork Porter’s Five Forces Analysis The bargaining power of buyers in flexible workspace sector…
how to Import many excel files with multiple sheets and appending each sheet into one dta file for each file with the same excel file name
Hello everyone,
I just joined Statalist. So this is my first post.
I would like to give you a brief idea about what I want to do and then explain the problem.
I have daily meter reading data of many firms stored in excel files of 3 sheets for each firms. I want to make a single dta file for each firm or file which has the same name as the excel file. I had to clean each excel sheets for a suitable data structure.
Following some posts in this forum, I was able to make a do file that worked partially:-
- cd "${january_T1}/J"
// number of sheets 3, so i=3
foreach f of local filenames {
forval i=1/3 {
display `"Importing `f'"'
import excel using "${january_T1}/J/`f'" ,sheet("Table `i'") cellrange(A6:R31) clear // the cellrange for sheets 1 and 2 is same
tostring _all, replace // making all observations string
replace A = "int_" + A if _n!=1 // adding prefix to intervals
rename A intervals // rename first column as intervals which is hourly intervals
** add prefix to first row as they start with numbers
foreach v of var B-Q {
replace `v' = "date_" + `v' if _n == 1
}
*** Replacing first row as variable names
foreach x of varlist B-Q {
local vname = strtoname(`x'[1])
rename `x' `vname'
}
drop in 1 // dropping first row
sxpose2, clear varname // transpose columns to rows for appending sheets
*** Replacing first row as variable names
foreach x of varlist _varname-_var24 {
local v_name = strtoname(`x'[1])
rename `x' `v_name'
}
cap gen filename = "`f'_Sheet`i'"
save "${meter_temp}\January\T1b/`f'_sheet`i'.dta", replace //
}
// loop over all sheets in each data file, while appending them and converting them to one dta for each firm for the month
*I am struggling to do the appending of 3 sheets using the code below, as I am not sure how to put it inside the loop above or even outside the loop.*
// number of sheets 3, so i=3
foreach f of local filenames {
use "${meter_temp}\January\T1b/`f'_sheet1.dta" , clear
append using "${meter_temp}\January\T1b/`f'_sheet2.dta"
*append using "${meter_temp}\January\T1b/`f'_sheet3.dta"
save "${meter_work}\January\T1b/`f'.dta", replace
}
Issues:
1) in ${meter_temp}\January\T1b folder, sheet 1 and 2 dta files are separately generated (for example t-6_8639746_january.xlsx_sheet1.dta and t-6_8639746_january.xlsx_sheet2.dta) however in the file names of sheet 1 and 2 ".xlsx" gets captured which I do not want. How can I remove this .xlsx part?
2) How can I append data of sheet 1-3 for each firm from the same folder keeping the same name? - shared an image file of all the files in the folder (https://ibb.co/ZHnJpyX)
WeWork marketing communication mix
 WeWork marketing communication mix comprises communication channels to communicate the marketing message to the target customer segment. These channels are print and media advertising, sales promotions, events and experiences, public relations and direct marketing. WeWork Print and Media Advertising The global flexible workspace provider uses print and media advertising extensively. The company uses TV, radio, magazines, newspapers, billboards and posters to convey their markeing message to potential customers. Specifically, WeWork print and media advertisements aim to encourage entrepreneurs and business owners to re-image their workspace to be a flexible and creatively designed to make the work process a highly rewarding experience. Recently, WeWork India started a brand campaign, ‘Great Inspires Great’, launching a series of three product films featuring their core products ‘On-demand’, ‘Managed Office’, and ‘Space as a Service’[1]. WeWork Sales Promotions Sales promotions can be defined as a marketing strategy where a company uses short-term campaigns to spark interest and create demand for a product, service or other offers. We work is not famous for using various forms of sales promotions techniques. The global flexible workspace provider occasionally offers free gifts as a sales promotion strategy. For example, in 2020 WeWork offered one month trial gift for new All Access subscription members. The global flexible workspace provider does not use seasonal sales promotions, discount vouchers, money off coupons, competitions, discount vouchers, loyalty program sales promotions methods. This is due to nature of products and services the company offers. WeWork Inc. Report contains a full analysis of WeWork marketing communication mix and WeWork marketing strategy in general. The report illustrates the application of the major analytical strategic frameworks in business studies such as SWOT, PESTEL, Porter’s Five Forces, Value Chain analysis, Ansoff Matrix and McKinsey 7S Model on WeWork. Moreover, the report contains analyses of WeWork leadership,…
WeWork Marketing Mix (WeWork 7Ps of Marketing)
 WeWork marketing mix (WeWork 7Ps of marketing) comprises elements of the marketing mix that consists of product, place, price, promotion, process, people and physical evidence. Product Element in WeWork Marketing Mix (WeWork 7Ps of Marketing) WeWork offers the following three products and services: Space as a service. Coworking space for small to medium sized businesses and flexible space solutions for enterprise companies. WeWork access. Workspaces around the world by the hour, day, or month through monthly subscription All Access product or pay-as-you-go On Demand product. Services within access category are similar to a gym membership model in a way that membership sales are not limited by the desk capacity within premises. WeWork Workplace. Workspace management software solution. It is software for landlords for online booking of desks, offices, collaboration hubs, and meeting rooms, in addition to providing meaningful utilization analytics, and helping to optimize space across assets. Place Element in WeWork Marketing Mix (WeWork 7Ps of Marketing) The co-working giant has a network of 756 locations in 38 countries, including 277 locations in the US as of December 2021. Customers can find information regarding the address of each location on company’s website and purchase WeWork products and services in any of these locations. Furthermore, customers can book flexible workspace using WeWork app at a time and place that is convenient to them. Price Element in WeWork Marketing Mix (WeWork 7Ps of Marketing) WeWork pricing strategy includes the following elements: Flexible pricing. The co-working giant applies a wide range of pricing options such as daily pay-as-you-go, as well as, monthly and yearly membership fees. Global flexible workspace provider can also offer custom payment plan for its large enterprise customers. Geographical pricing. As mentioned the workspace provider operates in 38 countries and prices vary in each country to…
Is there any way to stop pyStata while running?
We know that both python and Stata have the stop-process capability, but it seems impossible to do that through pystata. For example, suppose we run the following code:
And in the middle, we understand it is taking too long. Stopping the process through python does not work (I'm using Spyder IDE) and waits for the whole process to complete. Here is the video:
https://imgur.com/x92sRco
The other bug is that the rest of the python code becomes unstoppable when the stop is hit! because the stop has been hit once. For example, suppose we have the following code
Suppose we are in loop number 100 we understand this is taking a long time, and we hit stop. It does not stop; everything gets greyed out, and even the python can't be stopped. Many other unpredictable issues sometimes occur as well when ctrl+c is hit. For example, in this video:
https://imgur.com/a/pr8BGgp
Code:
import stata_setup
stata_setup.config("C:/Program Files/Stata17", "mp")
from pystata import stata

stata.run('''
foreach i  of numlist 1/4 {
    disp `i'
 sleep 1000
}
disp "End"
''')https://imgur.com/x92sRco
The other bug is that the rest of the python code becomes unstoppable when the stop is hit! because the stop has been hit once. For example, suppose we have the following code
Code:
import stata_setup
stata_setup.config("C:/Program Files/Stata17", "mp")
from pystata import stata
for i in range(10**3):
   stata.run('''
    sleep 1000
   ''')
print("end")https://imgur.com/a/pr8BGgp
Tuesday, February 21, 2023
Find matched firms
Hello everyone,
Hope everything is going well.
I have a question about how to identify the matched firm. The sample data is the following.
I want to identify the target firms (target=1) that match with focal firms (target=0) by the following criteria:
1. target firms (target=1) and focal firms(target=0) are in the same industries (same industry code);
2. the Size different between target firms (target=1) and focal firms(target=0) is less than 5% ( |% diff in Size| < 5% of focal firms (target=0)).
For example, for firms in 2009, target firm (target = 1, symbol = 466) is matched with focal firm (target = 0, symbol = 1889). Because these two firms share same industry code (industry = "C"). Also, target firm size (target = 1, symbol = 466, Size = 10.98468) is within 5% of focal firm size (target = 0, symbol = 1889, Size = 10.68249). In the other word, |10.98468 - 10.68249| < 5%*10.68249.
Much appreciated for your help, in advanced. And have a lovely day.
Cheers,
Frank
------------------ copy up to and including the previous line ------------------
Hope everything is going well.
I have a question about how to identify the matched firm. The sample data is the following.
I want to identify the target firms (target=1) that match with focal firms (target=0) by the following criteria:
1. target firms (target=1) and focal firms(target=0) are in the same industries (same industry code);
2. the Size different between target firms (target=1) and focal firms(target=0) is less than 5% ( |% diff in Size| < 5% of focal firms (target=0)).
For example, for firms in 2009, target firm (target = 1, symbol = 466) is matched with focal firm (target = 0, symbol = 1889). Because these two firms share same industry code (industry = "C"). Also, target firm size (target = 1, symbol = 466, Size = 10.98468) is within 5% of focal firm size (target = 0, symbol = 1889, Size = 10.68249). In the other word, |10.98468 - 10.68249| < 5%*10.68249.
Much appreciated for your help, in advanced. And have a lovely day.
Cheers,
Frank
Code:
* Example generated by -dataex-. For more info, type help dataex
clear
input double symbol float(year lag_Size target) str1 industry
   353 2009 11.908743 1 "C"
   430 2009  14.15009 1 "C"
   466 2009 10.984676 1 "C"
   469 2009  9.873674 1 "C"
   526 2009 13.150103 1 "C"
   631 2009  12.35215 1 "C"
   709 2009 12.046097 1 "C"
  1889 2009 10.682493 0 "C"
  1981 2009 11.658934 1 "I"
599931 2009  11.79596 1 "D"
600182 2009  11.63502 0 "F"
600289 2009 13.280113 0 "B"
600695 2009 13.557528 1 "S"
   288 2010  14.53094 1 "C"
   365 2010 11.574177 1 "C"
   381 2010 12.807743 0 "C"
   602 2010  10.66294 0 "L"
   652 2010 11.655706 0 "C"
  1817 2010  11.09666 1 "C"
  1998 2010  9.882786 0 "C"
  2017 2010 11.316225 0 "C"
  2063 2010 11.951778 0 "C"
  2185 2010 14.827463 1 "C"
299851 2010  11.65016 0 "I"
299886 2010 11.679768 0 "C"
599925 2010 12.312794 . "G"
599928 2010 12.259146 1 "F"
600302 2010  12.15644 1 "E"
600488 2010 14.607515 1 "C"
600771 2010 13.569136 1 "B"
601527 2010 15.686802 1 "C"
   201 2011  14.60073 0 "C"
   313 2011 12.489162 1 "C"
   431 2011 13.445896 0 "K"
   606 2011 12.256338 0 "C"
   635 2011 10.814608 0 "C"
  1916 2011  11.85497 1 "M"
  1919 2011 11.543577 1 "C"
  1951 2011 11.106693 0 "C"
  2117 2011 11.584675 1 "C"
  2235 2011 11.244164 0 "C"
  2301 2011 11.771706 0 "C"
299827 2011 11.895157 0 "R"
299843 2011  10.90149 0 "C"
299916 2011 10.531273 0 "C"
299927 2011 11.159685 1 "C"
299943 2011 11.030184 0 "A"
299945 2011 11.296352 0 "C"
300000 2011  12.55377 1 "C"
599855 2011  11.19978 0 "C"
600537 2011 13.267574 1 "C"
600601 2011  14.07104 1 "C"
600767 2011 12.057472 1 "C"
   344 2012  11.50715 1 "D"
   535 2012  12.47966 0 "A"
   556 2012 12.291164 1 "C"
  1905 2012   11.5334 1 "C"
  2109 2012  13.20733 0 "C"
  2121 2012 12.041492 0 "A"
  2299 2012 11.014174 0 "C"
  2330 2012 10.996252 0 "C"
  2412 2012 12.061598 1 "C"
300120 2012  12.92989 1 "C"
300120 2012  12.92989 1 "C"
599920 2012 13.254177 1 "F"
599992 2012 12.251202 1 "C"
600056 2012 14.127745 0 "S"
600333 2012  13.56007 1 "K"
600350 2012 14.038223 1 "C"
600475 2012 14.364258 1 "K"
600479 2012 11.347134 1 "C"
600664 2012  12.63239 1 "D"
600807 2012 12.063375 1 "H"
601315 2012 14.573185 1 "C"
601416 2012 12.484383 0 "C"
601677 2012  13.31427 1 "C"
   321 2013 13.256262 0 "C"
   483 2013  13.49034 1 "C"
   766 2013 13.705702 1 "D"
  1848 2013  12.84603 0 "C"
  1872 2013 11.593857 0 "C"
  1950 2013 11.065273 1 "C"
  1970 2013 11.810514 0 "C"
  2082 2013 11.373936 0 "C"
  2383 2013 12.126085 0 "C"
  2411 2013  11.05875 0 "C"
299935 2013  11.59205 1 "C"
299981 2013  11.04519 0 "C"
599943 2013 13.732157 0 "C"
600091 2013 13.992184 0 "C"
600298 2013  13.71964 1 "C"
600310 2013 13.627623 0 "K"
600317 2013 11.963255 1 "C"
600485 2013 13.576433 1 "C"
600502 2013 12.433384 0 "C"
600519 2013  11.57269 1 "D"
600546 2013  10.85954 1 "C"
600680 2013  12.33401 1 "R"
600682 2013  11.80856 0 "B"
600770 2013 14.250835 0 "C"
end
Backward Compatibility .mlib-s Complied in v17
Hi All,
Yesterday a user made an issue on the -domin- (SSC) package's GitHub page noting that they are getting an error that a Mata function was complied in Stata v17 and that older versions of Stata cannot use it.
I had never come across this before and couldn't find any documentation on this as a change for developers who use Mata.
I have access to Stata versions back to v12 but this behavior can be observed with versions as recent as v16 as well with a .mlib compiled with v17. I have an example below that is intended to be reproducible. I've included the paths to all the files for completeness. I did this on a Windows machine with Stata 17 MP and Stata 16 SE.
Note that the .mlib complied with Stata v17 fails to run when called with v16. The .mlib compiled with v16 works with both v16 and v17 however.
My question is whether there is a way to make an .mlib back compatible using v17 without using compiling using an older version of Stata.
- joe
Code:
. version 17

.
. clear all

.
. cd "C:\Users\jluchman\Documents\Statalist"
C:\Users\jluchman\Documents\Statalist

.
. **# Define .mata file for compliation
. file open mata_fn using st_mata.mata, write replace

.
. file write mata_fn "mata:" _newline(2)

.
. file write mata_fn "void say_something() {" _newline(2)

.
. file write mata_fn `"printf("looks like it works")"' _newline(2)

.
. file write mata_fn "}" _newline(2)

.
. file write mata_fn "end"

.
. file close mata_fn

.
. **# Define .do that compiles
. file open lm_bld using lmbuild_it.do, write replace

.
. file write lm_bld "clear all" _newline(2)

.
. file write lm_bld "do C:\Users\jluchman\Documents\Statalist\st_mata.mata" _newline(2)

.
. file write lm_bld `"lmbuild lb_statalist, replace dir(C:\Users\jluchman\Documents\Statalist\)"'

.
. file close lm_bld

.
. **# Define .do that calls say_something()
. file open say using do_say.do, write replace

.
. file write say `"adopath + "C:\Users\jluchman\Documents\Statalist\""' _newline(2)

.
. file write say "mata: mata mlib index" _newline(2)

.
. file write say "mata: say_something()"

.
. file close say

.
. **# Call V17 to compile
. shell "C:\Program Files\Stata17/StataMP-64" /e do "C:\Users\jluchman\Documents\Statalist\lmbuild_it.do"

.
. copy lmbuild_it.log lmbuild_it17.log, replace

.
. file open bld using lmbuild_it17.log, read

.
. local linenum = 0

.
. file read bld line

.
. while r(eof) == 0 {
  2.
.         local linenum = `linenum' + 1
  3.         if !inrange(`linenum', 12, 16) display %4.0f `linenum' _asis `"  `macval(line)'"'
  4.         file read bld line
  5.
. }
   1
   2    ___  ____  ____  ____  ____ ®
   3   /__    /   ____/   /   ____/      17.0
   4  ___/   /   /___/   /   /___/       MP—Parallel Edition
   5
   6   Statistics and Data Science       Copyright 1985-2021 StataCorp LLC
   7                                     StataCorp
   8                                     4905 Lakeway Drive
   9                                     College Station, Texas 77845 USA
  10                                     800-STATA-PC        https://www.stata.com
  11                                     979-696-4600        stata@stata.com
  17
  18  Notes:
  19        1. Stata is running in batch mode.
  20        2. Unicode is supported; see help unicode_advice.
  21        3. More than 2 billion observations are allowed; see help obs_advice.
  22        4. Maximum number of variables is set to 5,000; see help set_maxvar.
  23
  24  . do C:\Users\jluchman\Documents\Statalist\lmbuild_it.do
  25
  26  . clear all
  27
  28  .
  29  . do C:\Users\jluchman\Documents\Statalist\st_mata.mata
  30
  31  . mata:
  32  ------------------------------------------------- mata (type end to exit) -----
  33  :
  34  : void say_something() {
  35  >
  36  > printf("looks like it works")
  37  >
  38  > }
  39
  40  :
  41  : end
  42  -------------------------------------------------------------------------------
  43
  44  .
  45  end of do-file
  46
  47  .
  48  . lmbuild lb_statalist, replace dir(C:\Users\jluchman\Documents\Statalist\)
  49  (1 function added)
  50  existing library C:\Users\jluchman\Documents\Statalist\lb_statalist.mlib replac
  51  > ed
  52
  53  .
  54  end of do-file

.
. file close bld

.
. **# Call V17 do
. shell "C:\Program Files\Stata17/StataMP-64" /e do "C:\Users\jluchman\Documents\Statalist\do_say.do"

.
. copy do_say.log do_say17_cpl17.log, replace

.
. file open bld using do_say17_cpl17.log, read

.
. local linenum = 0

.
. file read bld line

.
. while r(eof) == 0 {
  2.
.         local linenum = `linenum' + 1
  3.         if !inrange(`linenum', 12, 16) display %4.0f `linenum' _asis `"  `macval(line)'"'
  4.         file read bld line
  5.
. }
   1
   2    ___  ____  ____  ____  ____ ®
   3   /__    /   ____/   /   ____/      17.0
   4  ___/   /   /___/   /   /___/       MP—Parallel Edition
   5
   6   Statistics and Data Science       Copyright 1985-2021 StataCorp LLC
   7                                     StataCorp
   8                                     4905 Lakeway Drive
   9                                     College Station, Texas 77845 USA
  10                                     800-STATA-PC        https://www.stata.com
  11                                     979-696-4600        stata@stata.com
  17
  18  Notes:
  19        1. Stata is running in batch mode.
  20        2. Unicode is supported; see help unicode_advice.
  21        3. More than 2 billion observations are allowed; see help obs_advice.
  22        4. Maximum number of variables is set to 5,000; see help set_maxvar.
  23
  24  . do C:\Users\jluchman\Documents\Statalist\do_say.do
  25
  26  . adopath + "C:\Users\jluchman\Documents\Statalist\"
  27    [1]  (BASE)      "C:\Program Files\Stata17\ado\base/"
  28    [2]  (SITE)      "C:\Program Files\Stata17\ado\site/"
  29    [3]              "."
  30    [4]  (PERSONAL)  "C:\Users\jluchman\ado\personal/"
  31    [5]  (PLUS)      "c:\ado\plus/"
  32    [6]  (OLDPLACE)  "c:\ado/"
  33    [7]              "C:\Users\jluchman\Documents\Statalist\"
  34
  35  .
  36  . mata: mata mlib index
  37  .mlib libraries to be searched are now
  38      lmatabase;lmataado;lmatabma;lmatacollect;lmataerm;lmatafc;lmatagsem;lmatala
  39  > sso;lmatamcmc;lmatameta;lmatami;lmatamixlog;lmatanumlib;lmataopt;lmatapath;lm
  40  > atapostest;lmatapss;lmatasem;lmatasp;lmatasvy;lmatatab;lb_statalist;lb_domina
  41  > nce;lmoremata;lmoremata10;lmoremata11;lmoremata14
  42
  43  .
  44  . mata: say_something()
  45  looks like it works
  46  .
  47  end of do-file

.
. file close bld

.
. **# Call V16 do
. shell "C:\Program Files\Stata16/StataSE-64" /e do "C:\Users\jluchman\Documents\Statalist\do_say.do"

.
. copy do_say.log do_say16_cpl17.log, replace

.
. file open bld using do_say16_cpl17.log, read

.
. local linenum = 0

.
. file read bld line

.
. while r(eof) == 0 {
  2.
.         local linenum = `linenum' + 1
  3.         if !inrange(`linenum', 12, 16) display %4.0f `linenum' _asis `"  `macval(line)'"'
  4.         file read bld line
  5.
. }
   1
   2    ___  ____  ____  ____  ____ (R)
   3   /__    /   ____/   /   ____/
   4  ___/   /   /___/   /   /___/   16.1   Copyright 1985-2019 StataCorp LLC
   5    Statistics/Data analysis            StataCorp
   6                                        4905 Lakeway Drive
   7       Special Edition                  College Station, Texas 77845 USA
   8                                        800-STATA-PC        https://www.stata.com
   9                                        979-696-4600        stata@stata.com
  10                                        979-696-4601 (fax)
  11
  17  Notes:
  18        1. Stata is running in batch mode.
  19        2. Unicode is supported; see help unicode_advice.
  20        3. Maximum number of variables is set to 5,000; see help set_maxvar.
  21
  22  . do C:\Users\jluchman\Documents\Statalist\do_say.do
  23
  24  . adopath + "C:\Users\jluchman\Documents\Statalist\"
  25    [1]  (BASE)      "C:\Program Files\Stata16\ado\base/"
  26    [2]  (SITE)      "C:\Program Files\Stata16\ado\site/"
  27    [3]              "."
  28    [4]  (PERSONAL)  "C:\Users\jluchman\ado\personal/"
  29    [5]  (PLUS)      "c:\ado\plus/"
  30    [6]  (OLDPLACE)  "c:\ado/"
  31    [7]              "C:\Users\jluchman\Documents\Statalist\"
  32
  33  .
  34  . mata: mata mlib index
  35  .mlib libraries to be searched are now
  36      lmatabase;lmataado;lmataerm;lmatafc;lmatagsem;lmatalasso;lmatamcmc;lmatamet
  37  > a;lmatami;lmatamixlog;lmatanumlib;lmataopt;lmatapath;lmatapostest;lmatapss;lm
  38  > atasem;lmatasp;lmatasvy;lmatatab;lb_statalist;lb_dominance;lmoremata;lmoremat
  39  > a10;lmoremata11;lmoremata14
  40
  41  .
  42  . mata: say_something()
  43  (say_something() in lb_statalist, compiled by Stata 17.0, is too new to be run
  44  by this version of Stata and so was ignored)
  45                   <istmt>:  3499  say_something() not found
  46  r(3499);
  47
  48  end of do-file
  49  r(3499);

.
. file close bld

.
. **# Call V16 to compile
. shell "C:\Program Files\Stata16/StataSE-64" /e do "C:\Users\jluchman\Documents\Statalist\lmbuild_it.do"

.
. copy lmbuild_it.log lmbuild_it16.log, replace

.
. file open bld using lmbuild_it16.log, read

.
. local linenum = 0

.
. file read bld line

.
. while r(eof) == 0 {
  2.
.         local linenum = `linenum' + 1
  3.         if !inrange(`linenum', 12, 16) display %4.0f `linenum' _asis `"  `macval(line)'"'
  4.         file read bld line
  5.
. }
   1
   2    ___  ____  ____  ____  ____ (R)
   3   /__    /   ____/   /   ____/
   4  ___/   /   /___/   /   /___/   16.1   Copyright 1985-2019 StataCorp LLC
   5    Statistics/Data analysis            StataCorp
   6                                        4905 Lakeway Drive
   7       Special Edition                  College Station, Texas 77845 USA
   8                                        800-STATA-PC        https://www.stata.com
   9                                        979-696-4600        stata@stata.com
  10                                        979-696-4601 (fax)
  11
  17  Notes:
  18        1. Stata is running in batch mode.
  19        2. Unicode is supported; see help unicode_advice.
  20        3. Maximum number of variables is set to 5,000; see help set_maxvar.
  21
  22  . do C:\Users\jluchman\Documents\Statalist\lmbuild_it.do
  23
  24  . clear all
  25
  26  .
  27  . do C:\Users\jluchman\Documents\Statalist\st_mata.mata
  28
  29  . mata:
  30  ------------------------------------------------- mata (type end to exit) -----
  31  :
  32  : void say_something() {
  33  >
  34  > printf("looks like it works")
  35  >
  36  > }
  37
  38  :
  39  : end
  40  -------------------------------------------------------------------------------
  41
  42  .
  43  end of do-file
  44
  45  .
  46  . lmbuild lb_statalist, replace dir(C:\Users\jluchman\Documents\Statalist\)
  47  (1 function added)
  48  existing library C:\Users\jluchman\Documents\Statalist\lb_statalist.mlib replac
  49  > ed
  50
  51  .
  52  end of do-file

.
. file close bld

.
.
. **# Call V17 do
. shell "C:\Program Files\Stata17/StataMP-64" /e do "C:\Users\jluchman\Documents\Statalist\do_say.do"

.
. copy do_say.log do_say17_cpl16.log, replace

.
. file open bld using do_say17_cpl16.log, read

.
. local linenum = 0

.
. file read bld line

.
. while r(eof) == 0 {
  2.
.         local linenum = `linenum' + 1
  3.         if !inrange(`linenum', 12, 16) display %4.0f `linenum' _asis `"  `macval(line)'"'
  4.         file read bld line
  5.
. }
   1
   2    ___  ____  ____  ____  ____ ®
   3   /__    /   ____/   /   ____/      17.0
   4  ___/   /   /___/   /   /___/       MP—Parallel Edition
   5
   6   Statistics and Data Science       Copyright 1985-2021 StataCorp LLC
   7                                     StataCorp
   8                                     4905 Lakeway Drive
   9                                     College Station, Texas 77845 USA
  10                                     800-STATA-PC        https://www.stata.com
  11                                     979-696-4600        stata@stata.com
  17
  18  Notes:
  19        1. Stata is running in batch mode.
  20        2. Unicode is supported; see help unicode_advice.
  21        3. More than 2 billion observations are allowed; see help obs_advice.
  22        4. Maximum number of variables is set to 5,000; see help set_maxvar.
  23
  24  . do C:\Users\jluchman\Documents\Statalist\do_say.do
  25
  26  . adopath + "C:\Users\jluchman\Documents\Statalist\"
  27    [1]  (BASE)      "C:\Program Files\Stata17\ado\base/"
  28    [2]  (SITE)      "C:\Program Files\Stata17\ado\site/"
  29    [3]              "."
  30    [4]  (PERSONAL)  "C:\Users\jluchman\ado\personal/"
  31    [5]  (PLUS)      "c:\ado\plus/"
  32    [6]  (OLDPLACE)  "c:\ado/"
  33    [7]              "C:\Users\jluchman\Documents\Statalist\"
  34
  35  .
  36  . mata: mata mlib index
  37  .mlib libraries to be searched are now
  38      lmatabase;lmataado;lmatabma;lmatacollect;lmataerm;lmatafc;lmatagsem;lmatala
  39  > sso;lmatamcmc;lmatameta;lmatami;lmatamixlog;lmatanumlib;lmataopt;lmatapath;lm
  40  > atapostest;lmatapss;lmatasem;lmatasp;lmatasvy;lmatatab;lb_statalist;lb_domina
  41  > nce;lmoremata;lmoremata10;lmoremata11;lmoremata14
  42
  43  .
  44  . mata: say_something()
  45  looks like it works
  46  .
  47  end of do-file

.
. file close bld

.
. **# Call V16 do
. shell "C:\Program Files\Stata16/StataSE-64" /e do "C:\Users\jluchman\Documents\Statalist\do_say.do"

.
. copy do_say.log do_say16_cpl16.log, replace

.
. file open bld using do_say16_cpl16.log, read

.
. local linenum = 0

.
. file read bld line

.
. while r(eof) == 0 {
  2.
.         local linenum = `linenum' + 1
  3.         if !inrange(`linenum', 12, 16) display %4.0f `linenum' _asis `"  `macval(line)'"'
  4.         file read bld line
  5.
. }
   1
   2    ___  ____  ____  ____  ____ (R)
   3   /__    /   ____/   /   ____/
   4  ___/   /   /___/   /   /___/   16.1   Copyright 1985-2019 StataCorp LLC
   5    Statistics/Data analysis            StataCorp
   6                                        4905 Lakeway Drive
   7       Special Edition                  College Station, Texas 77845 USA
   8                                        800-STATA-PC        https://www.stata.com
   9                                        979-696-4600        stata@stata.com
  10                                        979-696-4601 (fax)
  11
  17  Notes:
  18        1. Stata is running in batch mode.
  19        2. Unicode is supported; see help unicode_advice.
  20        3. Maximum number of variables is set to 5,000; see help set_maxvar.
  21
  22  . do C:\Users\jluchman\Documents\Statalist\do_say.do
  23
  24  . adopath + "C:\Users\jluchman\Documents\Statalist\"
  25    [1]  (BASE)      "C:\Program Files\Stata16\ado\base/"
  26    [2]  (SITE)      "C:\Program Files\Stata16\ado\site/"
  27    [3]              "."
  28    [4]  (PERSONAL)  "C:\Users\jluchman\ado\personal/"
  29    [5]  (PLUS)      "c:\ado\plus/"
  30    [6]  (OLDPLACE)  "c:\ado/"
  31    [7]              "C:\Users\jluchman\Documents\Statalist\"
  32
  33  .
  34  . mata: mata mlib index
  35  .mlib libraries to be searched are now
  36      lmatabase;lmataado;lmataerm;lmatafc;lmatagsem;lmatalasso;lmatamcmc;lmatamet
  37  > a;lmatami;lmatamixlog;lmatanumlib;lmataopt;lmatapath;lmatapostest;lmatapss;lm
  38  > atasem;lmatasp;lmatasvy;lmatatab;lb_statalist;lb_dominance;lmoremata;lmoremat
  39  > a10;lmoremata11;lmoremata14
  40
  41  .
  42  . mata: say_something()
  43  looks like it works
  44  .
  45  end of do-file

.
. file close bld

.Recoding
Hello,
I have the variable gender which was originally coded as 1 = male and 2 = female. I went in and changed the code with the following: recode gender (1=0) (2=1). This led to it coming out as: male = 1 and 0 (this has no label attached to it because I made a permanent mistake).
My goal is to code male = 0 and female = 1 with the label "male and female" attached to each value and was wondering how I can achieve this.
Problem with storing regression estimates while using "scfcombo" package for Survey of Consumer Finance data
All,
I am trying to neatly store and organize regression results in Stata 16.0 version. However, I am using Survey of Consumer Finance data and thus have been using the "scfcombo" package to run my regression commands.
Code:
So when I try to store the regression results using the "estimates" command, I receive an error saying: "last estimation results not found, nothing to store. " Is it possible to store "scfcombo" regression command results in Stata version 16.0?
Thanks in advance!
I am trying to neatly store and organize regression results in Stata 16.0 version. However, I am using Survey of Consumer Finance data and thus have been using the "scfcombo" package to run my regression commands.
Code:
Code:
*install scfcombo macro in Stata
ssc install scfcombo

*Regression Analysis (scfcombo)

scfcombo TOTAL_FAM_INC NON_AC_BUS [aw=WGT0], command(regress) reps(200) imps(5)
estimates store m1, title(TOTAL_FAM_INC)
So when I try to store the regression results using the "estimates" command, I receive an error saying: "last estimation results not found, nothing to store. " Is it possible to store "scfcombo" regression command results in Stata version 16.0?
Thanks in advance!
What kind of interpolating should I use?
I have a daily dataset with global aggregate numbers of an index and a monthly index of countries specifically. As the changes in the daily ones are very sporadic and volatile I can't use linear interpolation, which my supervisor agreed on. So I am trying to find a way to interpolate the country specific monthly figures to daily figures based on the global aggregate daily figure changes. I am taking the assumption that both are extremely correlated to validate this approach. How should I approach this and through which stata commands as I am not familiar with different interpolation methods and their pros and cons.
Example of the dataset for the first month where GPRD = is daily variable and GPRC_DEU the monthly
Many thanks!
Steven
Example of the dataset for the first month where GPRD = is daily variable and GPRC_DEU the monthly
| date | GPRD | GPRC_DEU |
| 01/01/2022 | 62.95 | 1.26 |
| 02/01/2022 | 37.86 | |
| 03/01/2022 | 55.74 | |
| 04/01/2022 | 93.54 | |
| 05/01/2022 | 95.46 | |
| 06/01/2022 | 73.92 | |
| 07/01/2022 | 119.16 | |
| 08/01/2022 | 38.28 | |
| 09/01/2022 | 63.70 | |
| 10/01/2022 | 135.54 | |
| 11/01/2022 | 192.97 | |
| 12/01/2022 | 81.38 | |
| 13/01/2022 | 177.09 | |
| 14/01/2022 | 134.17 | |
| 15/01/2022 | 71.06 | |
| 16/01/2022 | 45.75 | |
| 17/01/2022 | 115.06 | |
| 18/01/2022 | 144.46 | |
| 19/01/2022 | 155.56 | |
| 20/01/2022 | 138.22 | |
| 21/01/2022 | 194.31 | |
| 22/01/2022 | 145.81 | |
| 23/01/2022 | 106.86 | |
| 24/01/2022 | 184.03 | |
| 25/01/2022 | 296.21 | |
| 26/01/2022 | 271.75 | |
| 27/01/2022 | 267.22 | |
| 28/01/2022 | 189.41 | |
| 29/01/2022 | 217.44 | |
| 30/01/2022 | 63.53 | |
| 31/01/2022 | 149.44 | |
| 01/02/2022 | 192.65 | 2.62 |
Steven
Cleaning challenge blanks in variables
Hello
when reshaping data, from long to wide, we wanted to make each row per director, and all the companies their associated with as different variables (e.g. otherdirectorcompany 1 otherdirectorcompany2 otherdirectorcompany3...)
however it has inserted lots of blanks, such that our company variables goes from otherdirectorcompany1 all the way to otherdirectorcompany737
Is there a way to delete the blanks such that it shifts the non-blanks left?
Here is the dataex (with sample of otherdirectorcompanyn variables - they do go continuously from 1 to 737):
Any help would be much appreciated
Best
when reshaping data, from long to wide, we wanted to make each row per director, and all the companies their associated with as different variables (e.g. otherdirectorcompany 1 otherdirectorcompany2 otherdirectorcompany3...)
however it has inserted lots of blanks, such that our company variables goes from otherdirectorcompany1 all the way to otherdirectorcompany737
Is there a way to delete the blanks such that it shifts the non-blanks left?
Here is the dataex (with sample of otherdirectorcompanyn variables - they do go continuously from 1 to 737):
Code:
* Example generated by -dataex-. To install: ssc install dataex clear input str54 directorname str66(otherdirectorcompany1 otherdirectorcompany2 otherdirectorcompany20 otherdirectorcompany21 otherdirectorcompany22 otherdirectorcompany40 otherdirectorcompany41 otherdirectorcompany42 otherdirectorcompany200) "Abdool-Samad Tasneem" "" "" "Absa Financial Services Limited" "" "" "" "" "" "" "Adebayo Kazeem" "" "" "" "" "" "" "" "" "" "Africa Brendan" "" "" "" "" "" "" "" "" "" "Ahern Anet" "" "" "" "" "" "" "" "" "" "Ally Fathima" "" "" "" "" "" "" "" "" "" "Ally Mustak" "" "" "" "" "" "" "" "" "" "Andre Louw Korsten" "" "" "" "" "" "" "" "" "" "Andriesa Johanna Korsten" "" "" "" "" "" "" "" "" "" "Anel Kotze" "" "" "" "" "" "" "" "" "" "Anthony Bradley" "" "" "" "" "" "" "" "" "" "Aranda Idoya" "" "" "" "" "" "" "" "" "" "Armstrong Brian" "" "" "" "" "" "" "" "" "" "Arnold Michael" "" "" "" "" "" "" "" "" "" "Artus Duncan" "" "" "" "" "" "" "" "" "" "Bailey Lester" "" "" "" "" "" "" "" "" "" "Baldock Henrietta" "" "" "" "" "" "" "" "" "" "Baleni Msokoli" "" "" "" "" "" "" "" "" "" "Baloyi Paul" "" "" "" "" "" "" "" "" "" "Bam Lwazi" "" "" "" "" "" "" "" "" "" "Barkhuysen Marius" "" "" "" "" "" "" "" "" "" "Bassa Zarina" "" "" "" "" "" "" "" "" "" "Bassier Khadeeja" "" "" "" "" "" "" "" "" "" "Bekker Jacobus" "" "" "" "" "" "" "" "" "" "Bellingan GP" "" "" "" "" "" "" "" "" "" "Bethlehem Lael" "" "" "" "" "" "" "" "" "" "Bezuidenhout Jacobus" "" "" "" "" "" "" "" "" "" "Bhettay Nadya Fatima" "" "" "" "" "" "" "" "" "" "Binedell Engelbert" "" "" "" "" "" "" "" "" "" "Bird Stuart" "" "" "" "" "" "" "" "" "" "Birrell Andrew" "" "" "" "" "" "" "" "" "" "Blades Simon Andrew" "" "" "" "" "" "" "" "" "" "Blumenthal Henry" "" "" "" "" "" "" "" "" "" "Boardman Thomas" "" "" "" "" "" "" "" "" "" "Bomela Mary" "" "" "" "" "" "" "" "" "" "Booi Pambili Mtutuzeli" "" "" "" "" "" "" "" "" "" "Boonzaier Nicolaas" "" "" "" "" "" "" "" "" "" "Boonzaier Reynecke Nicolaas" "" "" "" "" "" "" "" "" "" "Booth Charles" "" "" "" "" "" "" "" "" "" "Booysen Stefanes Francois (Steve)" "" "" "" "" "" "" "" "" "" "Bosman Hermanus" "" "" "" "" "" "" "" "" "" "Botha Anton" "" "" "" "" "" "" "" "" "" "Botha Susan" "" "" "" "" "" "" "" "" "" "Botha Susan Louise (Santie)" "" "" "" "" "" "" "" "" "" "Bouwer Beverley" "" "" "" "" "" "" "" "" "" "Boyce Lulama" "" "" "" "" "" "" "" "" "" "Boyes Jamie " "" "" "" "" "" "" "" "" "" "Bradley Anthony " "" "" "" "" "" "" "" "" "" "Briesies Reece" "" "" "" "" "" "" "" "" "" "Brody Hubert" "" "" "" "" "" "" "" "" "" "Brown Michael" "" "" "" "" "" "" "" "" "" "Brown Neil" "" "" "" "" "" "" "" "" "" "Brown Steven" "" "" "" "" "" "" "" "" "" "Burger Johan" "" "" "" "" "" "" "" "" "" "Burger Johan Petrus" "" "" "" "" "" "" "" "" "" "Burnett Meagen" "" "" "" "" "" "" "" "" "" "Burton Patrick" "" "" "" "" "" "" "" "" "" "Bydawell Bruce" "" "" "" "" "" "" "" "" "" "Campher Leon" "" "" "" "" "" "" "" "" "" "Capazorio Sean" "" "" "" "" "" "" "" "" "" "Carolus Cheryl" "" "" "" "" "" "" "" "" "" "Cele Sibonelo" "" "" "" "" "" "" "" "" "" "Chapman Warren" "" "" "" "" "" "" "" "" "" "Charreton Didier" "" "" "" "" "" "" "" "" "" "Chetty Thavanesan" "" "" "" "" "" "" "" "" "" "Chirwa Nditshe" "" "" "" "" "" "" "" "" "" "Chiume Lisa" "" "" "" "" "" "" "" "" "" "Churr Rudi" "" "" "" "" "" "" "" "" "" "Cilliers Jeanette" "" "" "" "" "" "" "" "" "Equilibrium Investment Management (Pty) Ltd" "Clark Philip" "" "" "" "" "" "" "" "" "" "Cluer Paul" "" "" "" "" "" "" "" "" "" "Coetzee Abraham Andre" "" "" "" "" "" "" "" "" "" "Coetzee Abraham Andre " "" "" "" "" "" "" "" "" "" "Coetzer Johan" "" "" "" "" "" "" "" "" "" "Coffee Gert Johannes" "" "" "" "" "" "" "" "" "" "Cohen Laurence Richard" "" "" "" "" "" "" "" "" "" "Collis John" "" "" "" "" "" "" "" "" "" "Collopy Terence" "" "" "" "" "" "" "" "" "" "Combi Zitulele" "" "" "" "" "" "" "" "" "" "Conrad Alethea" "" "" "" "" "" "" "" "" "" "Cook Paul" "" "" "" "" "" "" "" "" "" "Cooper Maheshvera" "" "" "" "" "" "" "" "" "" "Cooper Peter" "" "" "" "" "" "" "" "" "" "Criticos Nick" "" "" "" "" "" "" "" "" "" "Cummins John" "" "" "" "" "" "" "" "" "" "Cunningham Anthony" "" "" "" "" "" "" "" "" "" "Currie Louise" "" "" "" "" "" "" "" "" "" "Daehnke Arno" "" "" "" "" "" "" "" "" "" "Dambuza Amanda" "" "" "" "" "" "" "" "" "" "Dames Brian" "" "" "" "" "" "" "" "" "" "Darko Alex" "" "" "" "" "" "" "" "" "" "Davis Michael" "" "" "" "" "" "" "" "" "" "De Villier Gerhardus Francois" "" "" "" "" "" "" "" "" "" "De Vries Anastasia Jane" "" "" "" "" "" "" "" "" "" "Desai Prakash" "" "" "" "" "" "" "" "" "" "Dickson Carlo" "" "" "" "" "" "" "" "" "" "Dlamini Kuseni" "" "" "" "" "" "" "" "" "" "Dloti Thabo" "" "" "" "" "" "" "" "" "" "Dolamo Anne" "" "" "" "" "" "" "" "" "" "Dongwana Neo" "" "" "" "" "" "" "" "" "" "Dotwana Loyiso" "" "" "" "" "" "Afrimat Ltd" "" "" "" end
Best